Introduction to R
We are studying inflammation in patients who have been given a new treatment for arthritis, and need to analyze the first dozen data sets. The data sets are stored in comma-separated values (CSV) format. Each row holds the observations for just one patient. Each column holds the inflammation measured in a day, so we have a set of values in successive days. The first few rows of our first file look like this:
0,0,1,3,1,2,4,7,8,3,3,3,10,5,7,4,7,7,12,18,6,13,11,11,7,7,4,6,8,8,4,4,5,7,3,4,2,3,0,0
0,1,2,1,2,1,3,2,2,6,10,11,5,9,4,4,7,16,8,6,18,4,12,5,12,7,11,5,11,3,3,5,4,4,5,5,1,1,0,1
0,1,1,3,3,2,6,2,5,9,5,7,4,5,4,15,5,11,9,10,19,14,12,17,7,12,11,7,4,2,10,5,4,2,2,3,2,2,1,1
0,0,2,0,4,2,2,1,6,7,10,7,9,13,8,8,15,10,10,7,17,4,4,7,6,15,6,4,9,11,3,5,6,3,3,4,2,3,2,1
0,1,1,3,3,1,3,5,2,4,4,7,6,5,3,10,8,10,6,17,9,14,9,7,13,9,12,6,7,7,9,6,3,2,2,4,2,0,1,1
We want to:
- Load data into memory,
- Calculate the average value of inflammation per day across all patients, and
- Plot the results.
To do all that, we’ll have to learn a little bit about programming.
Let’s Start with:
export MODULEPATH="${MODULEPATH}:/hpc/modules/workshop"
module --ignore-cache load r_rstudio
cp -R /hpc/examples/workshops/hpc/r-inflammation ~/
cd ~/r-inflammation
srun -p development,htc,mic -c 1 --mem=6G --pty -t 0-2 m2_rstudio
Loading Data
Let’s import the file called inflammation-01.csv into our R environment. To import the file, first we need to tell our computer where the file is. We do that by choosing a working directory, that is, a local directory on our computer containing the files we need. This is very important in R. If we forget this step we’ll get an error message saying that the file does not exist. We can set the working directory using the function setwd. For this example, we change the path to our new directory at the desktop:
setwd("~/r-inflammation/")
Just like in the Unix Shell, we type the command and then press Return (or Enter).
Alternatively you can change the working directory using the RStudio GUI using the menu option Session -> Set Working Directory -> Choose Directory...
The data file is located in the directory data inside the working directory. Now we can load the data into R using read.csv:
read.csv(file = "inflammation-01.csv", header = FALSE)
The expression read.csv(...) is a function call that asks R to run the function read.csv.
read.csv has two arguments: the name of the file we want to read, and whether the first line of the file contains names for the columns of data.
The filename needs to be a character string (or string for short), so we put it in quotes. Assigning the second argument, header, to be FALSE indicates that the data file does not have column headers. We’ll talk more about the value FALSE, and its converse TRUE, in lesson 04. In case of our inflammation-01.csv example, R auto-generates column names in the sequence V1 (for “variable 1”), V2, and so on, until V40.
Other Options for Reading CSV Files
read.csvactually has many more arguments that you may find useful when importing your own data in the future. You can learn more about these options in this supplementary lesson.
Loading Data with Headers
What happens if you forget to put
header = FALSE? The default value isheader = TRUE, which you can check with?read.csvorhelp(read.csv). What do you expect will happen if you leave the default value? Before you run any code, think about what will happen to the first few rows of your data frame, and its overall size. Then run the following code and see if your expectations agree:read.csv(file = "inflammation-01.csv")Solution
R will construct column headers from values in your first row of data, resulting in
X0 X0.1 X1 X3 X1.1 X2 ....Note that the
Xis prepended just a number would not be a valid variable name. Because that’s what column headers are, the same rules apply. Appending.1,.2etc. is necessary to avoid duplicate column headers.
Reading Different Decimal Point Formats
Depending on the country you live in, your standard can use the dot or the comma as decimal mark. Also, different devices or software can generate data with different decimal points. Take a look at
?read.csvand write the code to load a file calledcommadec.txtthat has numeric values with commas as decimal mark, separated by semicolons.Solution
read.csv(file = "data/commadec.txt", sep = ";", dec = ",")or the built-in shortcut:
read.csv2(file = "data/commadec.txt")
A function will perform its given action on whatever value is passed to the argument(s).
For example, in this case if we provided the name of a different file to the argument file, read.csv would read that instead.
We’ll learn more about the details of functions and their arguments in the next lesson.
Since we didn’t tell it to do anything else with the function’s output, the console will display the full contents of the file inflammation-01.csv.
Try it out.
read.csv reads the file, but we can’t use the data unless we assign it to a variable.
We can think of a variable as a container with a name, such as x, current_temperature, or subject_id that contains one or more values.
We can create a new variable and assign a value to it using <-.
weight_kg <- 55
Once a variable is created, we can use the variable name to refer to the value it was assigned. The variable name now acts as a tag. Whenever R reads that tag (weight_kg), it substitutes the value (55).
To see the value of a variable, we can print it by typing the name of the variable and hitting Return (or Enter). In general, R will print to the console any object returned by a function or operation unless we assign it to a variable.
weight_kg
[1] 55
We can treat our variable like a regular number, and do arithmetic with it:
# weight in pounds:
2.2 * weight_kg
[1] 121
Commenting
We can add comments to our code using the
#character. It is useful to document our code in this way so that others (and us the next time we read it) have an easier time following what the code is doing.
We can also change a variable’s value by assigning it a new value:
weight_kg <- 57.5
# weight in kilograms is now
weight_kg
[1] 57.5
Variable Naming Conventions
Historically, R programmers have used a variety of conventions for naming variables. The
.character in R can be a valid part of a variable name; thus the above assignment could have easily beenweight.kg <- 57.5. This is often confusing to R newcomers who have programmed in languages where.has a more significant meaning. Today, most R programmers 1) start variable names with lower case letters, 2) separate words in variable names with underscores, and 3) use only lowercase letters, underscores, and numbers in variable names. The book R Packages includes a chapter on this and other style considerations.
Assigning a new value to a variable breaks the connection with the old value; R forgets that number and applies the variable name to the new value.
When you assign a value to a variable, R only stores the value, not the calculation you used to create it. This is an important point if you’re used to the way a spreadsheet program automatically updates linked cells. Let’s look at an example.
First, we’ll convert weight_kg into pounds, and store the new value in the variable weight_lb:
weight_lb <- 2.2 * weight_kg
# weight in kg...
weight_kg
[1] 57.5
# ...and in pounds
weight_lb
[1] 126.5
In words, we’re asking R to look up the value we tagged weight_kg,
multiply it by 2.2, and tag the result with the name weight_lb:
If we now change the value of weight_kg:
weight_kg <- 100.0
# weight in kg now...
weight_kg
[1] 100
# ...and weight in pounds still
weight_lb
[1] 126.5
Since weight_lb doesn’t “remember” where its value came from, it isn’t automatically updated when weight_kg changes.
This is different from the way spreadsheets work.
Printing with Parentheses
An alternative way to print the value of a variable is to use
(parentheses)around the assignment statement. As an example:(total_weight <- weight_kg + weight_lb)adds the values ofweight_kgandweight_lb, assigns the result to thetotal_weight, and finally prints the assigned value of the variabletotal_weight.
Now that we know how to assign things to variables, let’s re-run read.csv and save its result into a variable called ‘dat’:
dat <- read.csv(file = "inflammation-01.csv", header = FALSE)
This statement doesn’t produce any output because the assignment doesn’t display anything.
If we want to check if our data has been loaded, we can print the variable’s value by typing the name of the variable dat. However, for large data sets it is convenient to use the function head to display only the first few rows of data.
head(dat)
  V1 V2 V3 V4 V5 V6 V7 V8 V9 V10 V11 V12 V13 V14 V15 V16 V17 V18 V19 V20
1  0  0  1  3  1  2  4  7  8   3   3   3  10   5   7   4   7   7  12  18
2  0  1  2  1  2  1  3  2  2   6  10  11   5   9   4   4   7  16   8   6
3  0  1  1  3  3  2  6  2  5   9   5   7   4   5   4  15   5  11   9  10
4  0  0  2  0  4  2  2  1  6   7  10   7   9  13   8   8  15  10  10   7
5  0  1  1  3  3  1  3  5  2   4   4   7   6   5   3  10   8  10   6  17
6  0  0  1  2  2  4  2  1  6   4   7   6   6   9   9  15   4  16  18  12
  V21 V22 V23 V24 V25 V26 V27 V28 V29 V30 V31 V32 V33 V34 V35 V36 V37 V38
1   6  13  11  11   7   7   4   6   8   8   4   4   5   7   3   4   2   3
2  18   4  12   5  12   7  11   5  11   3   3   5   4   4   5   5   1   1
3  19  14  12  17   7  12  11   7   4   2  10   5   4   2   2   3   2   2
4  17   4   4   7   6  15   6   4   9  11   3   5   6   3   3   4   2   3
5   9  14   9   7  13   9  12   6   7   7   9   6   3   2   2   4   2   0
6  12   5  18   9   5   3  10   3  12   7   8   4   7   3   5   4   4   3
  V39 V40
1   0   0
2   0   1
3   1   1
4   2   1
5   1   1
6   2   1
Assigning Values to Variables
Draw diagrams showing what variables refer to what values after each statement in the following program:
mass <- 47.5
age <- 122
mass <- mass * 2.0
age <- age - 20
Solution
mass <- 47.5
age <- 122
mass <- mass * 2.0
age <- age - 20
Manipulating Data
Now that our data are loaded into R, we can start doing things with them.
First, let’s ask what type of thing dat is:
class(dat)
[1] "data.frame"
The output tells us that it’s a data frame. Think of this structure as a spreadsheet in MS Excel that many of us are familiar with. Data frames are very useful for storing data and you will use them frequently when programming in R. A typical data frame of experimental data contains individual observations in rows and variables in columns.
We can see the shape, or dimensions, of the data frame with the function dim:
dim(dat)
[1] 60 40
This tells us that our data frame, dat, has 60 rows and 40 columns.
If we want to get a single value from the data frame, we can provide an index in square brackets. The first number specifies the row and the second the column:
# first value in dat, row 1, column 1
dat[1, 1]
[1] 0
# middle value in dat, row 30, column 20
dat[30, 20]
[1] 16
The first value in a data frame index is the row, the second value is the column.
If we want to select more than one row or column, we can use the function c, which stands for combine.
For example, to pick columns 10 and 20 from rows 1, 3, and 5, we can do this:
dat[c(1, 3, 5), c(10, 20)]
  V10 V20
1   3  18
3   9  10
5   4  17
We frequently want to select contiguous rows or columns, such as the first ten rows, or columns 3 through 7. You can use c for this, but it’s more convenient to use the : operator. This special function generates sequences of numbers:
1:5
[1] 1 2 3 4 5
3:12
[1] 3 4 5 6 7 8 9 10 11 12
For example, we can select the first ten columns of values for the first four rows like this:
dat[1:4, 1:10]
  V1 V2 V3 V4 V5 V6 V7 V8 V9 V10
1  0  0  1  3  1  2  4  7  8   3
2  0  1  2  1  2  1  3  2  2   6
3  0  1  1  3  3  2  6  2  5   9
4  0  0  2  0  4  2  2  1  6   7
or the first ten columns of rows 5 to 10 like this:
dat[5:10, 1:10]
   V1 V2 V3 V4 V5 V6 V7 V8 V9 V10
5   0  1  1  3  3  1  3  5  2   4
6   0  0  1  2  2  4  2  1  6   4
7   0  0  2  2  4  2  2  5  5   8
8   0  0  1  2  3  1  2  3  5   3
9   0  0  0  3  1  5  6  5  5   8
10  0  1  1  2  1  3  5  3  5   8
If you want to select all rows or all columns, leave that index value empty.
# All columns from row 5
dat[5, ]
  V1 V2 V3 V4 V5 V6 V7 V8 V9 V10 V11 V12 V13 V14 V15 V16 V17 V18 V19 V20
5  0  1  1  3  3  1  3  5  2   4   4   7   6   5   3  10   8  10   6  17
  V21 V22 V23 V24 V25 V26 V27 V28 V29 V30 V31 V32 V33 V34 V35 V36 V37 V38
5   9  14   9   7  13   9  12   6   7   7   9   6   3   2   2   4   2   0
  V39 V40
5   1   1
# All rows from column 16-18
dat[, 16:18]
   V16 V17 V18
1    4   7   7
2    4   7  16
3   15   5  11
4    8  15  10
5   10   8  10
6   15   4  16
7   13   5  12
8    9  15  11
9   11   9  10
10   6  13   8
11   3   7  13
12   8  14  11
13  12   4  17
14   3  10  13
15   5   7  17
16  10   7   8
17  11  12   5
18   4  14   7
19  11  15  17
20  13   6   5
21  15  13   6
22   5  12  12
23  14   5   5
24  13   7  14
25   4  12   9
26   9   5  16
27  13   4  13
28   6  15   6
29   7   6  11
30   6   8   7
31  14  12   8
32   3   8  10
33  15  15  10
34   4  12   9
35  15   9  17
36  11   5   7
37   7   4   7
38  10   6   7
39  15  12  13
40   6   8  15
41   5   7   5
42   6  10  13
43  15  11  12
44  11   6  10
45  15  12  15
46   6   7  11
47  11  16  12
48  15   5  15
49  14   4   6
50   4   7   9
51  10  13   6
52  15  15  12
53  11  15  13
54   6  11  12
55  13   8   9
56   8   8  16
57   4  16  11
58  13  13   9
59  12  15   5
60   9  14  11
If you leave both index values empty (i.e., dat[,]), you get the entire data frame.
Addressing Columns by Name
Columns can also be addressed by name, with either the
$operator (ie.dat$V16) or square brackets (ie.dat[, 'V16']). You can learn more about subsetting by column name in this supplementary lesson.
Now let’s perform some common mathematical operations to learn more about our inflammation data. When analyzing data we often want to look at partial statistics, such as the maximum value per patient or the average value per day. One way to do this is to select the data we want to create a new temporary data frame, and then perform the calculation on this subset:
# first row, all of the columns
patient_1 <- dat[1, ]
# max inflammation for patient 1
max(patient_1)
[1] 18
We don’t actually need to store the row in a variable of its own. Instead, we can combine the selection and the function call:
# max inflammation for patient 2
max(dat[2, ])
[1] 18
R also has functions for other common calculations, e.g. finding the minimum, mean, median, and standard deviation of the data:
# minimum inflammation on day 7
min(dat[, 7])
[1] 1
# mean inflammation on day 7
mean(dat[, 7])
[1] 3.8
# median inflammation on day 7
median(dat[, 7])
[1] 4
# standard deviation of inflammation on day 7
sd(dat[, 7])
[1] 1.725187
Forcing Conversion
Note that R may return an error when you attempt to perform similar calculations on subsetted rows of data frames. This is because some functions in R automatically convert the object type to a numeric vector, while others do not (e.g.
max(dat[1, ])works as expected, whilemean(dat[1, ])returnsNAand a warning). You get the expected output by including an explicit call toas.numeric(), e.g.mean(as.numeric(dat[1, ])). By contrast, calculations on subsetted columns always work as expected, since columns of data frames are already defined as vectors.
R also has a function that summaries the previous common calculations:
# Summarize function
summary(dat[, 1:4])
       V1          V2             V3              V4
 Min.   :0   Min.   :0.00   Min.   :0.000   Min.   :0.00
 1st Qu.:0   1st Qu.:0.00   1st Qu.:1.000   1st Qu.:1.00
 Median :0   Median :0.00   Median :1.000   Median :2.00
 Mean   :0   Mean   :0.45   Mean   :1.117   Mean   :1.75
 3rd Qu.:0   3rd Qu.:1.00   3rd Qu.:2.000   3rd Qu.:3.00
 Max.   :0   Max.   :1.00   Max.   :2.000   Max.   :3.00
For every column in the data frame, the function “summary” calculates: the minimun value, the first quartile, the median, the mean, the third quartile and the max value, giving helpful details about the sample distribution.
What if we need the maximum inflammation for all patients, or the average for each day? As the diagram below shows, we want to perform the operation across a margin of the data frame:
To support this, we can use the apply function.
Getting Help
To learn about a function in R, e.g.
apply, we can read its help documention by runninghelp(apply)or?apply.
apply allows us to repeat a function on all of the rows (MARGIN = 1) or columns (MARGIN = 2) of a data frame.
Thus, to obtain the average inflammation of each patient we will need to calculate the mean of all of the rows (MARGIN = 1) of the data frame.
avg_patient_inflammation <- apply(dat, 1, mean)
And to obtain the average inflammation of each day we will need to calculate the mean of all of the columns (MARGIN = 2) of the data frame.
avg_day_inflammation <- apply(dat, 2, mean)
Since the second argument to apply is MARGIN, the above command is equivalent to apply(dat, MARGIN = 2, mean).
We’ll learn why this is so in the next lesson.
Efficient Alternatives
Some common operations have more efficient alternatives. For example, you can calculate the row-wise or column-wise means with
rowMeansandcolMeans, respectively.
Subsetting Data
We can take subsets of character vectors as well:
animal <- c("m", "o", "n", "k", "e", "y")
# first three characters
animal[1:3]
[1] "m" "o" "n"# last three characters animal[4:6][1] "k" "e" "y"
If the first four characters are selected using the subset
animal[1:4], how can we obtain the first four characters in reverse order?What is
animal[-1]? What isanimal[-4]? Given those answers, explain whatanimal[-1:-4]does.Use a subset of
animalto create a new character vector that spells the word “eon”, i.e.c("e", "o", "n").Solutions
animal[4:1]
"o" "n" "k" "e" "y"and"m" "o" "n" "e" "y", which means that a single-removes the element at the given index position.animal[-1:-4]remove the subset, returning"e" "y", which is equivalent toanimal[5:6].
animal[c(5,2,3)]combines indexing with thecombine function.
Subsetting More Data
Suppose you want to determine the maximum inflammation for patient 5 across days three to seven. To do this you would extract the relevant subset from the data frame and calculate the maximum value. Which of the following lines of R code gives the correct answer?
max(dat[5, ])max(dat[3:7, 5])max(dat[5, 3:7])max(dat[5, 3, 7])Solution
Answer: 3
Explanation: You want to extract the part of the dataframe representing data for patient 5 from days three to seven. In this dataframe, patient data is organised in rows and the days are represented by the columns. Subscripting in R follows the
[i, j]principle, wherei = rowsandj = columns. Thus, answer 3 is correct since the patient is represented by the value for i (5) and the days are represented by the values in j, which is a subset spanning day 3 to 7.
Subsetting and Re-Assignment
Using the inflammation data frame
datfrom above: Let’s pretend there was something wrong with the instrument on the first five days for every second patient (#2, 4, 6, etc.), which resulted in the measurements being twice as large as they should be.
- Write a vector containing each affected patient (hint:
?seq)- Create a new data frame in which you halve the first five days’ values in only those patients
- Print out the corrected data frame to check that your code has fixed the problem
Solution
whichPatients <- seq(2, 60, 2) # i.e., which rows
whichDays <- seq(1, 5)         # i.e., which columns
dat2 <- dat
# check the size of your subset: returns `30 5`, that is 30 [rows=patients] by 5 [columns=days]
dim(dat2[whichPatients, whichDays])
dat2[whichPatients, whichDays] <- dat2[whichPatients, whichDays] / 2
dat2
Using the Apply Function on Patient Data
Challenge: the apply function can be used to summarize datasets and subsets of data across rows and columns using the MARGIN argument. Suppose you want to calculate the mean inflammation for specific days and patients in the patient dataset (i.e. 60 patients across 40 days).
Please use a combination of the apply function and indexing to:
- calculate the mean inflammation for patients 1 to 5 over the whole 40 days
- calculate the mean inflammation for days 1 to 10 (across all patients).
- calculate the mean inflammation for every second day (across all patients).
Think about the number of rows and columns you would expect as the result before each apply call and check your intuition by applying the mean function.
Solution
# 1.
apply(dat[1:5, ], 1, mean)
# 2.
apply(dat[, 1:10], 2, mean)
# 3.
apply(dat[, seq(1, 40, by = 2)], 2, mean)
Plotting
The mathematician Richard Hamming once said, “The purpose of computing is insight, not numbers,” and the best way to develop insight is often to visualize data. Visualization deserves an entire lecture (or course) of its own, but we can explore a few of R’s plotting features.
Let’s take a look at the average inflammation over time.
Recall that we already calculated these values above using apply(dat, 2, mean) and saved them in the variable avg_day_inflammation.
Plotting the values is done with the function plot.
plot(avg_day_inflammation)
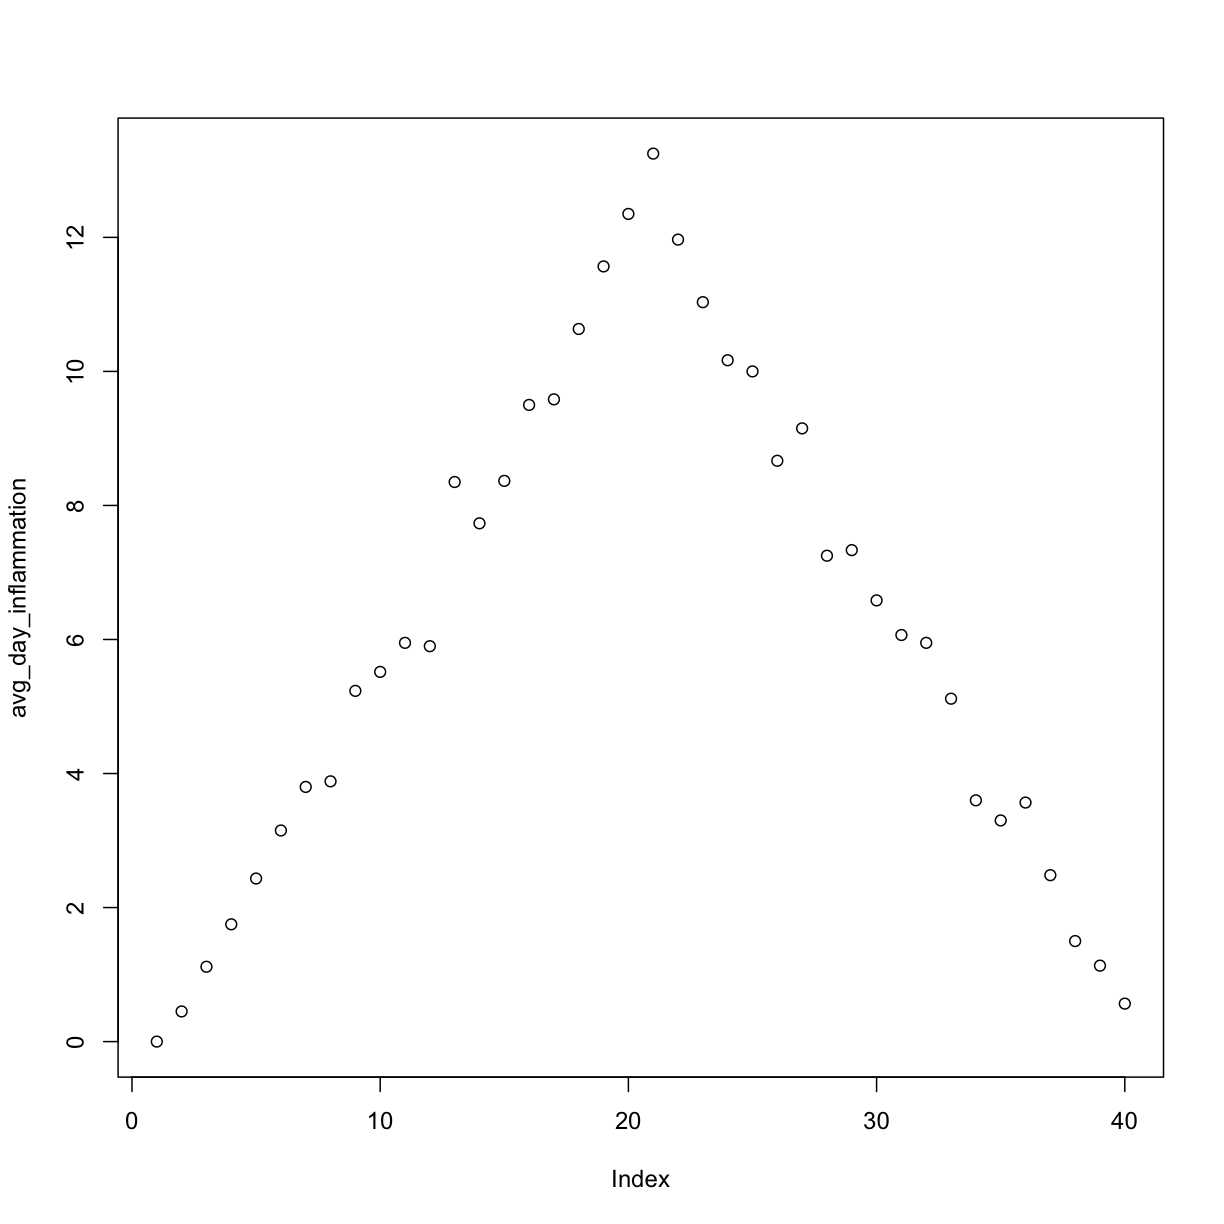
Above, we gave the function plot a vector of numbers corresponding to the average inflammation per day across all patients.
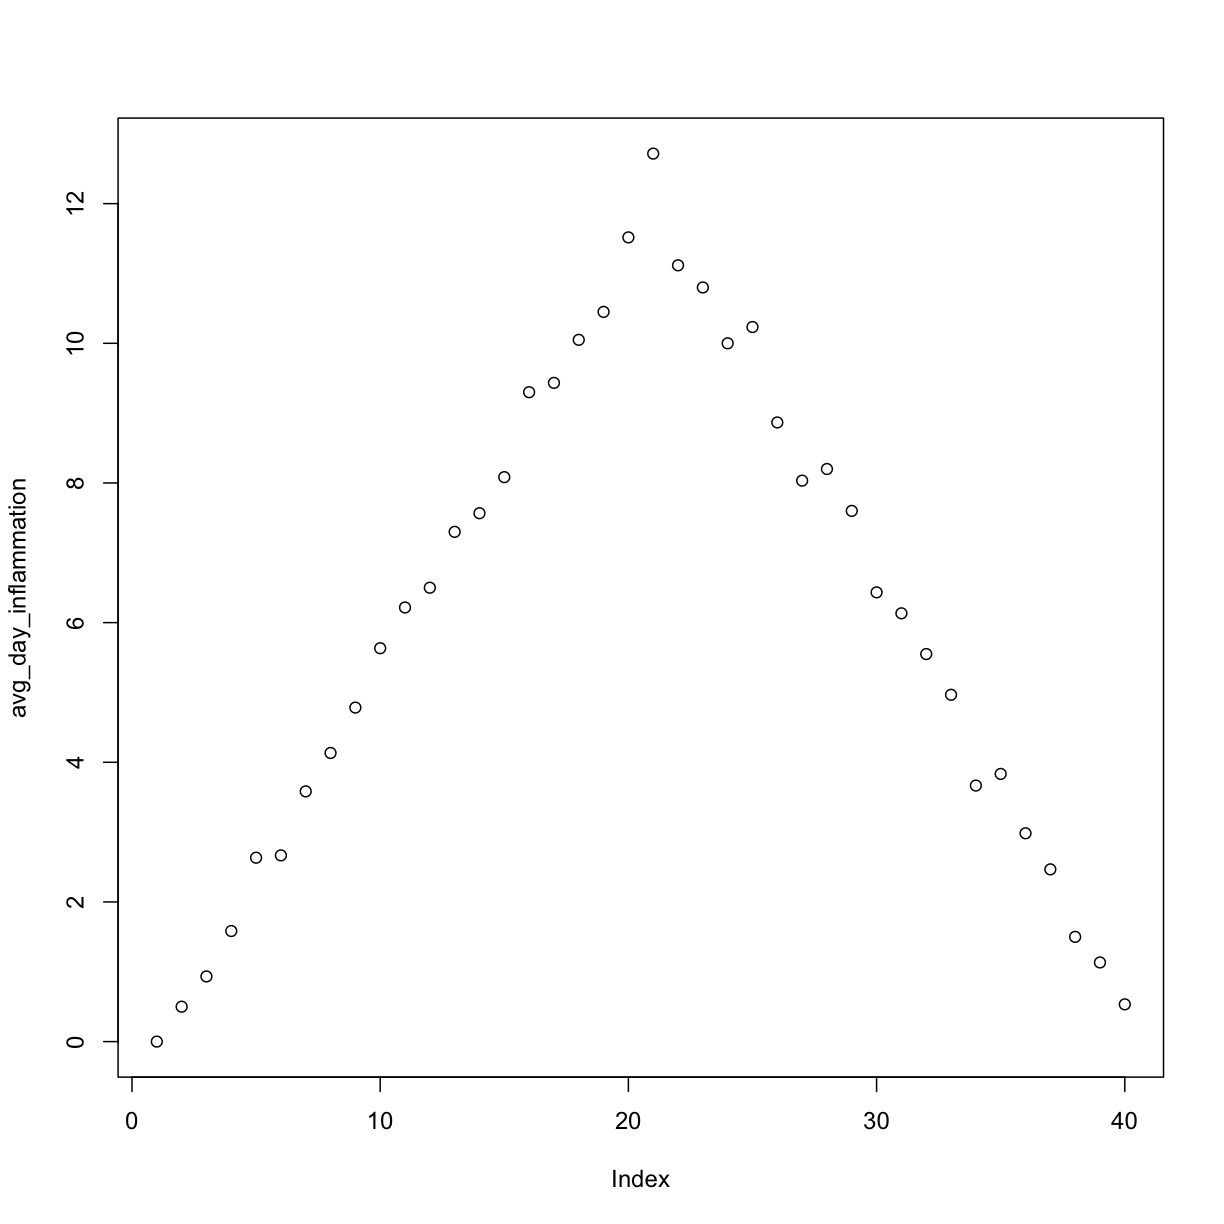
plot created a scatter plot where the y-axis is the average inflammation level and the x-axis is the order, or index, of the values in the vector, which in this case correspond to the 40 days of treatment.
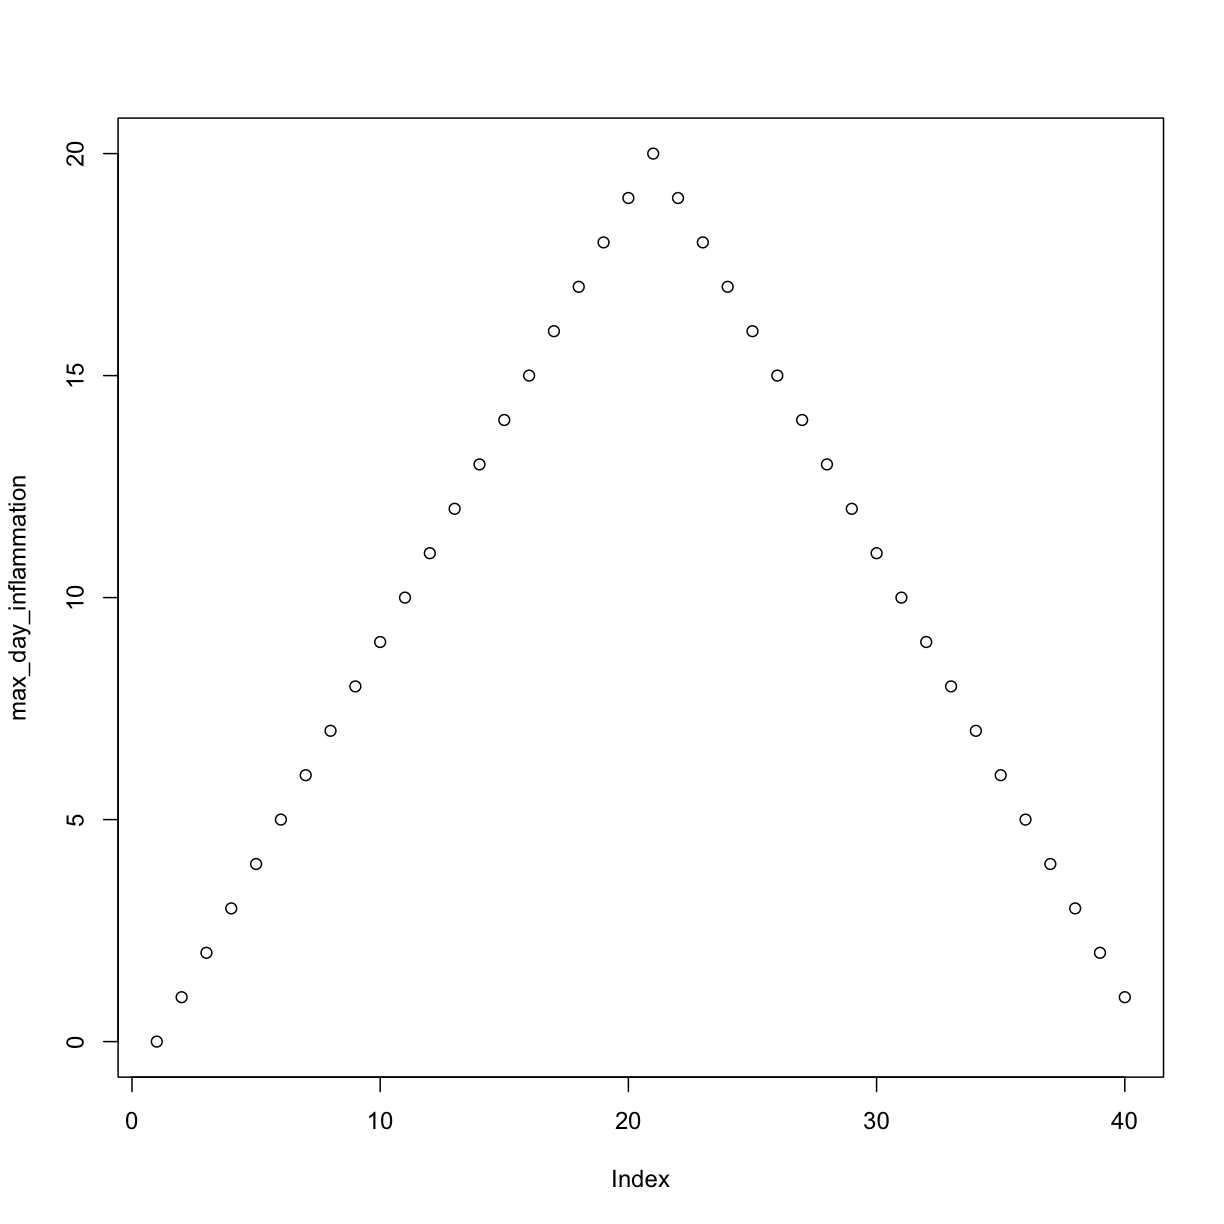
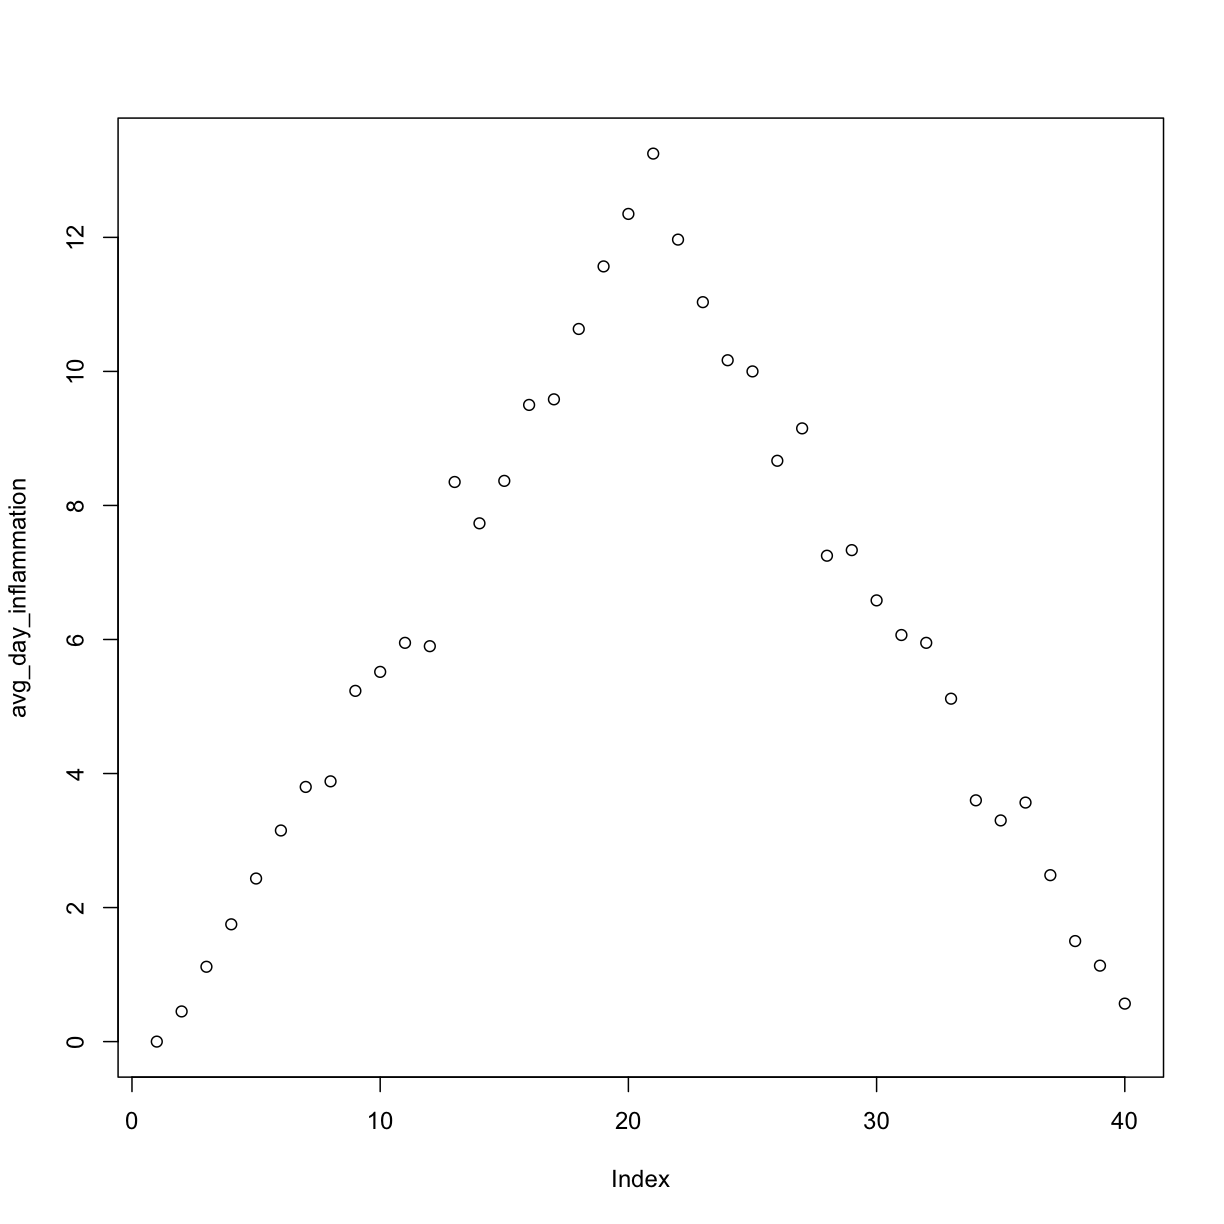
The result is roughly a linear rise and fall, which is suspicious: based on other studies, we expect a sharper rise and slower fall.
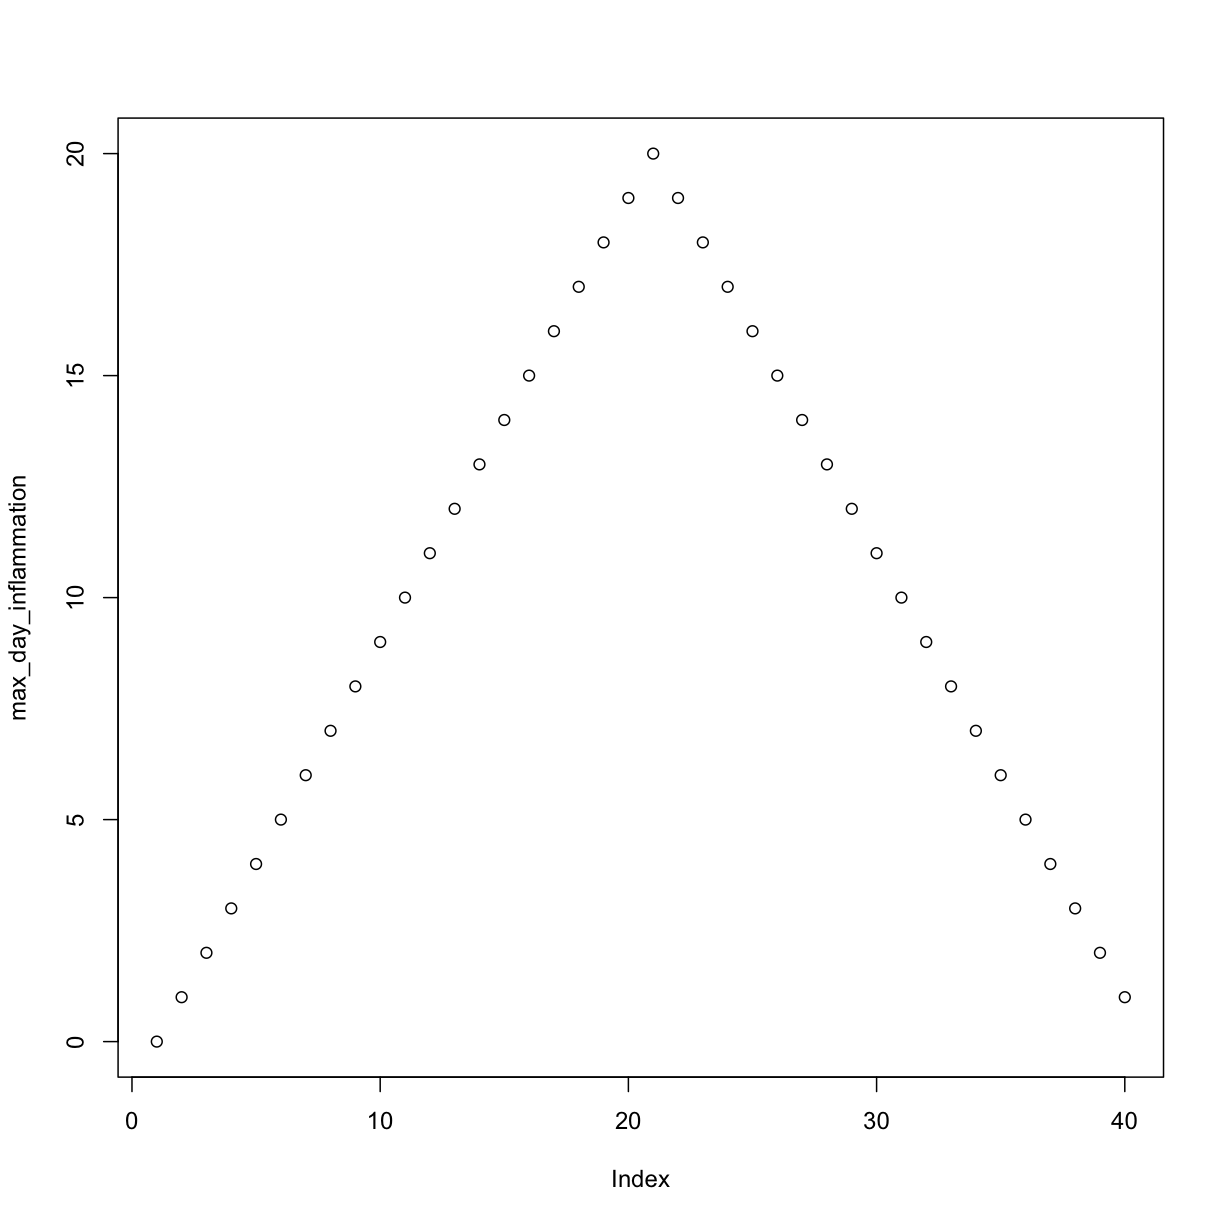
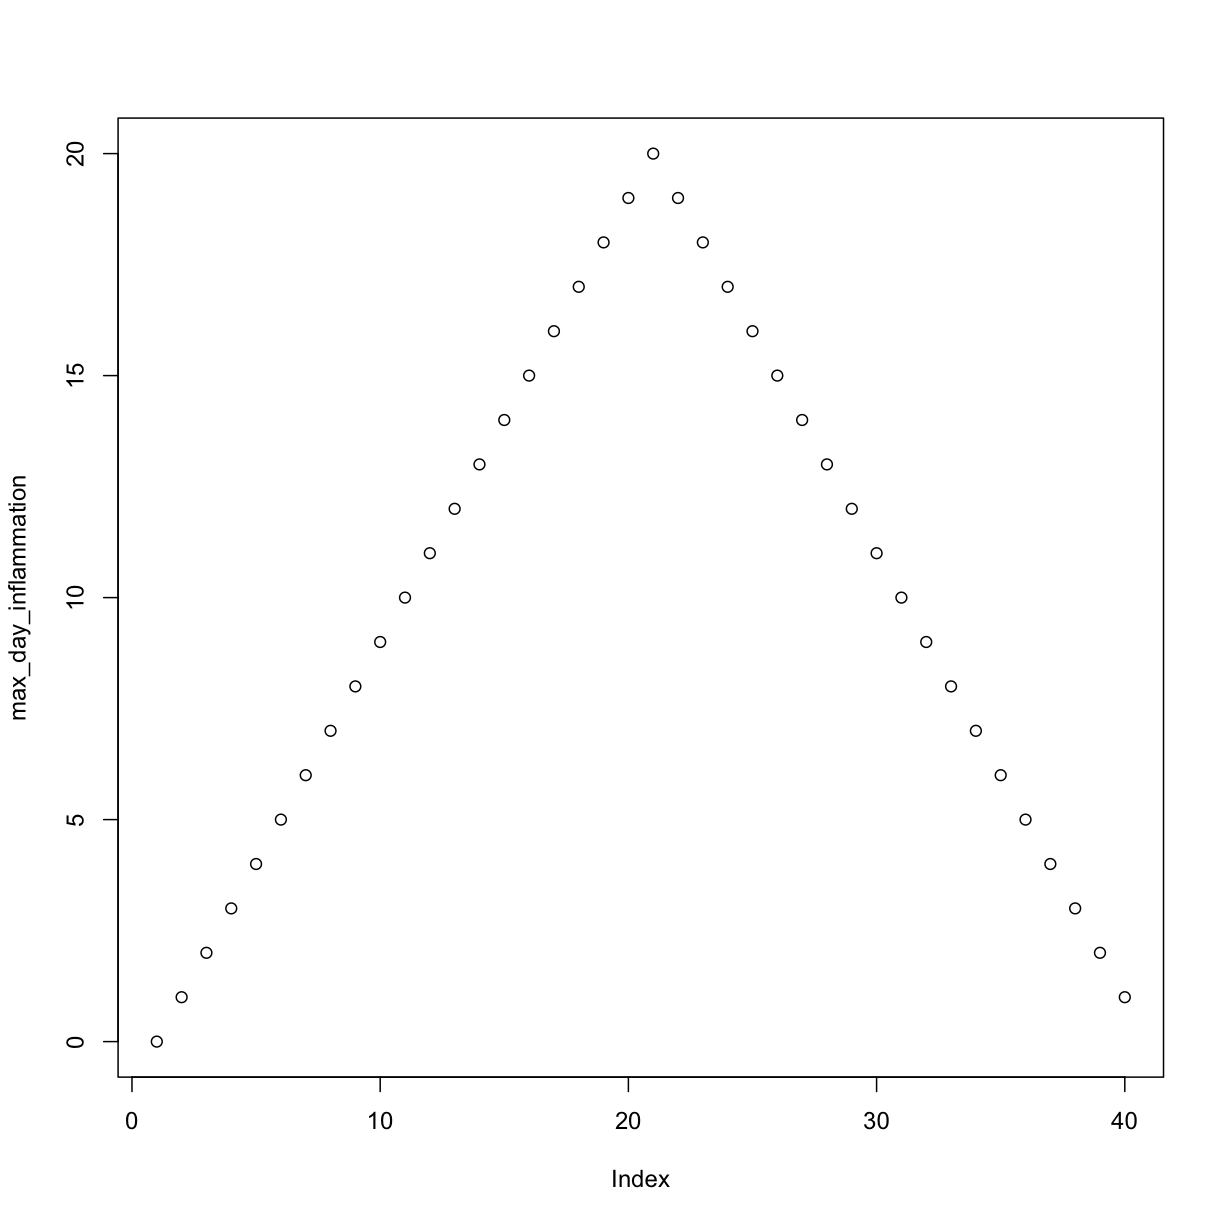
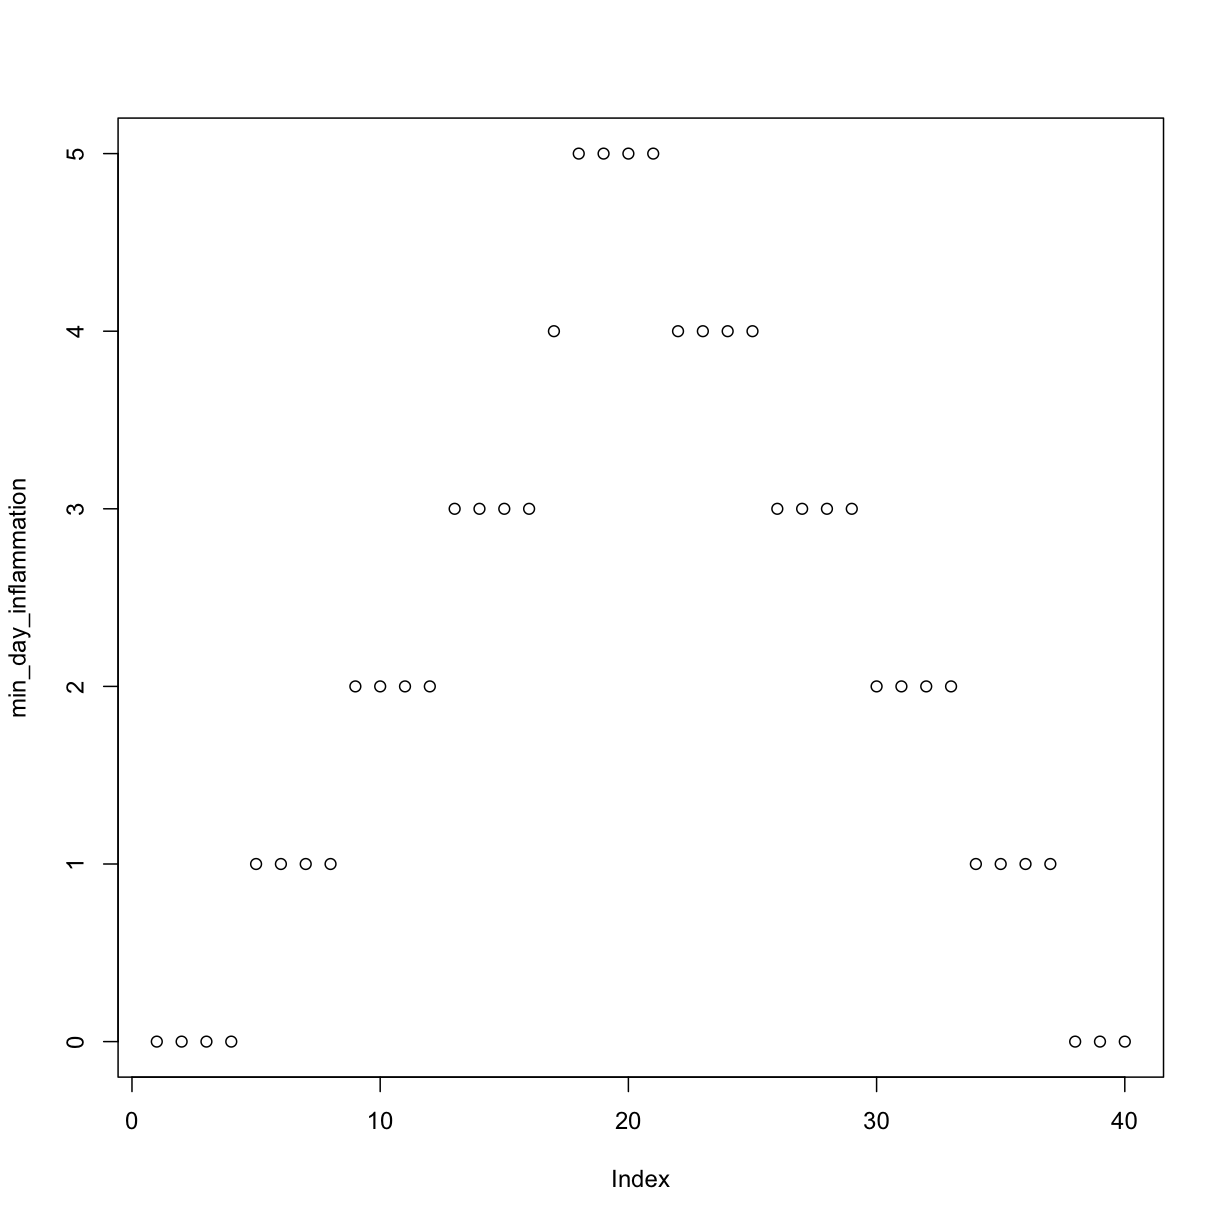
Let’s have a look at two other statistics: the maximum and minimum inflammation per day.
max_day_inflammation <- apply(dat, 2, max)
plot(max_day_inflammation)
min_day_inflammation <- apply(dat, 2, min)
plot(min_day_inflammation)
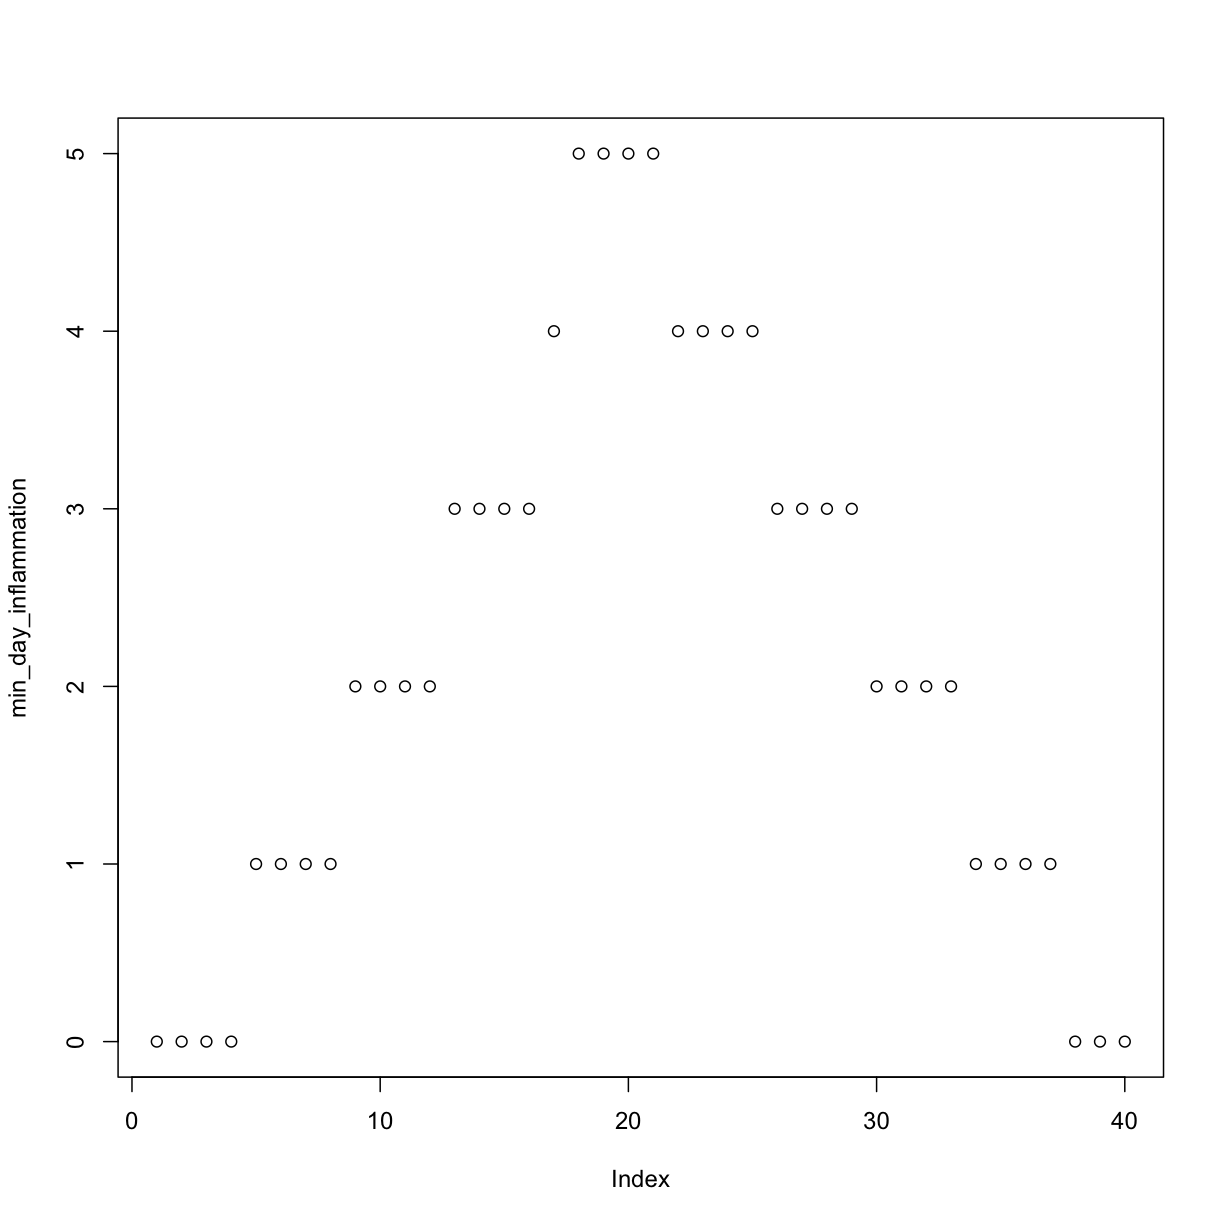
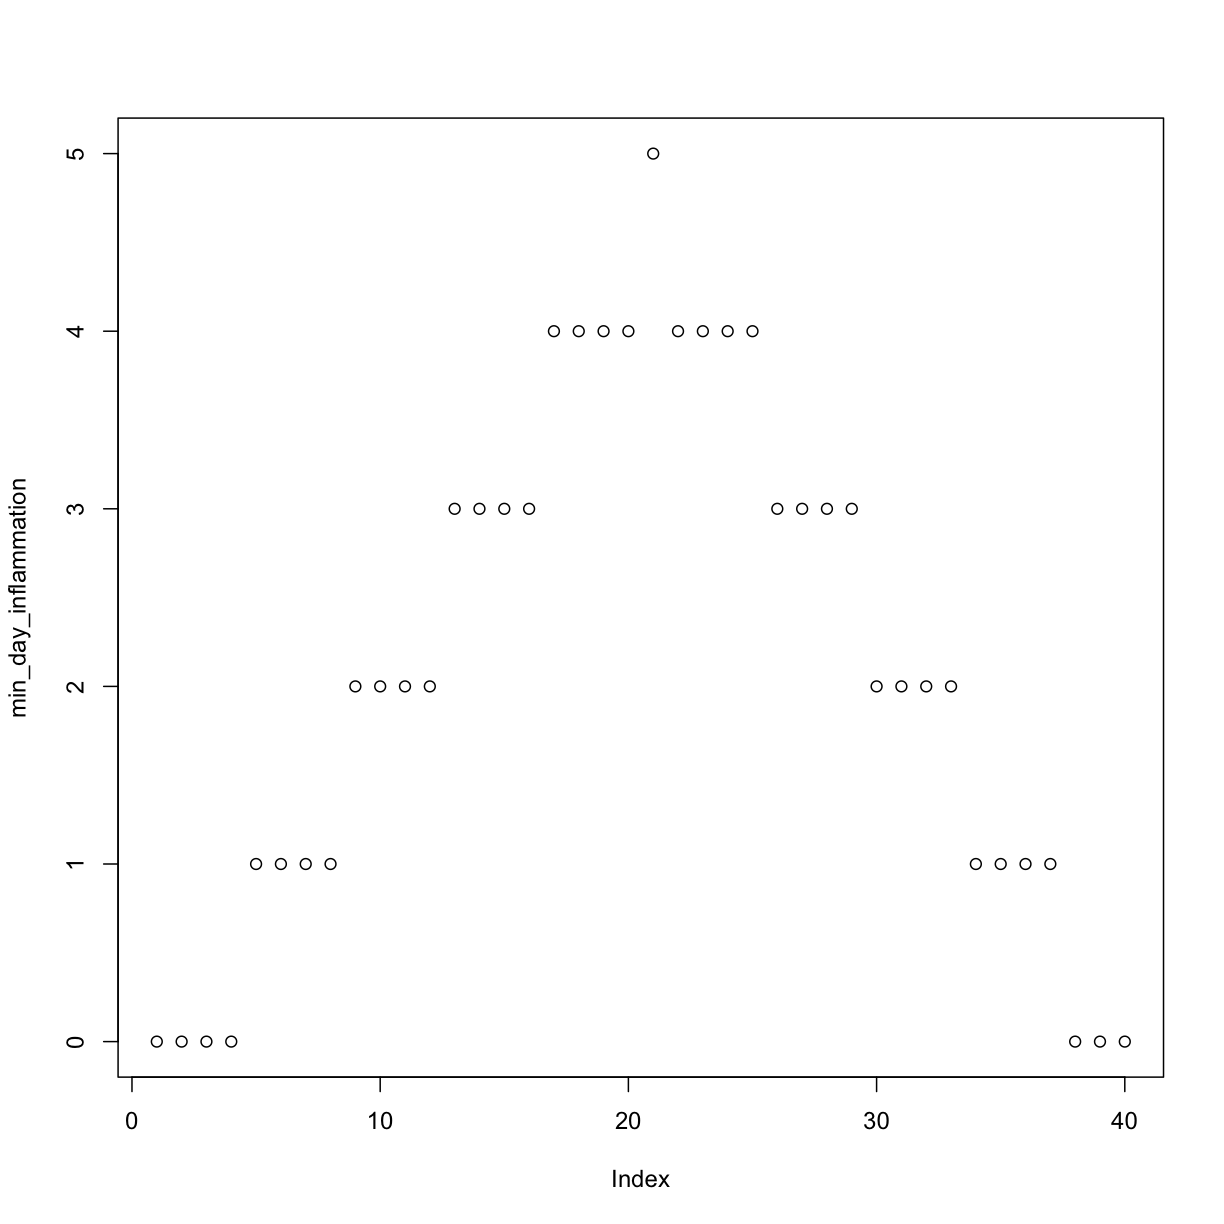
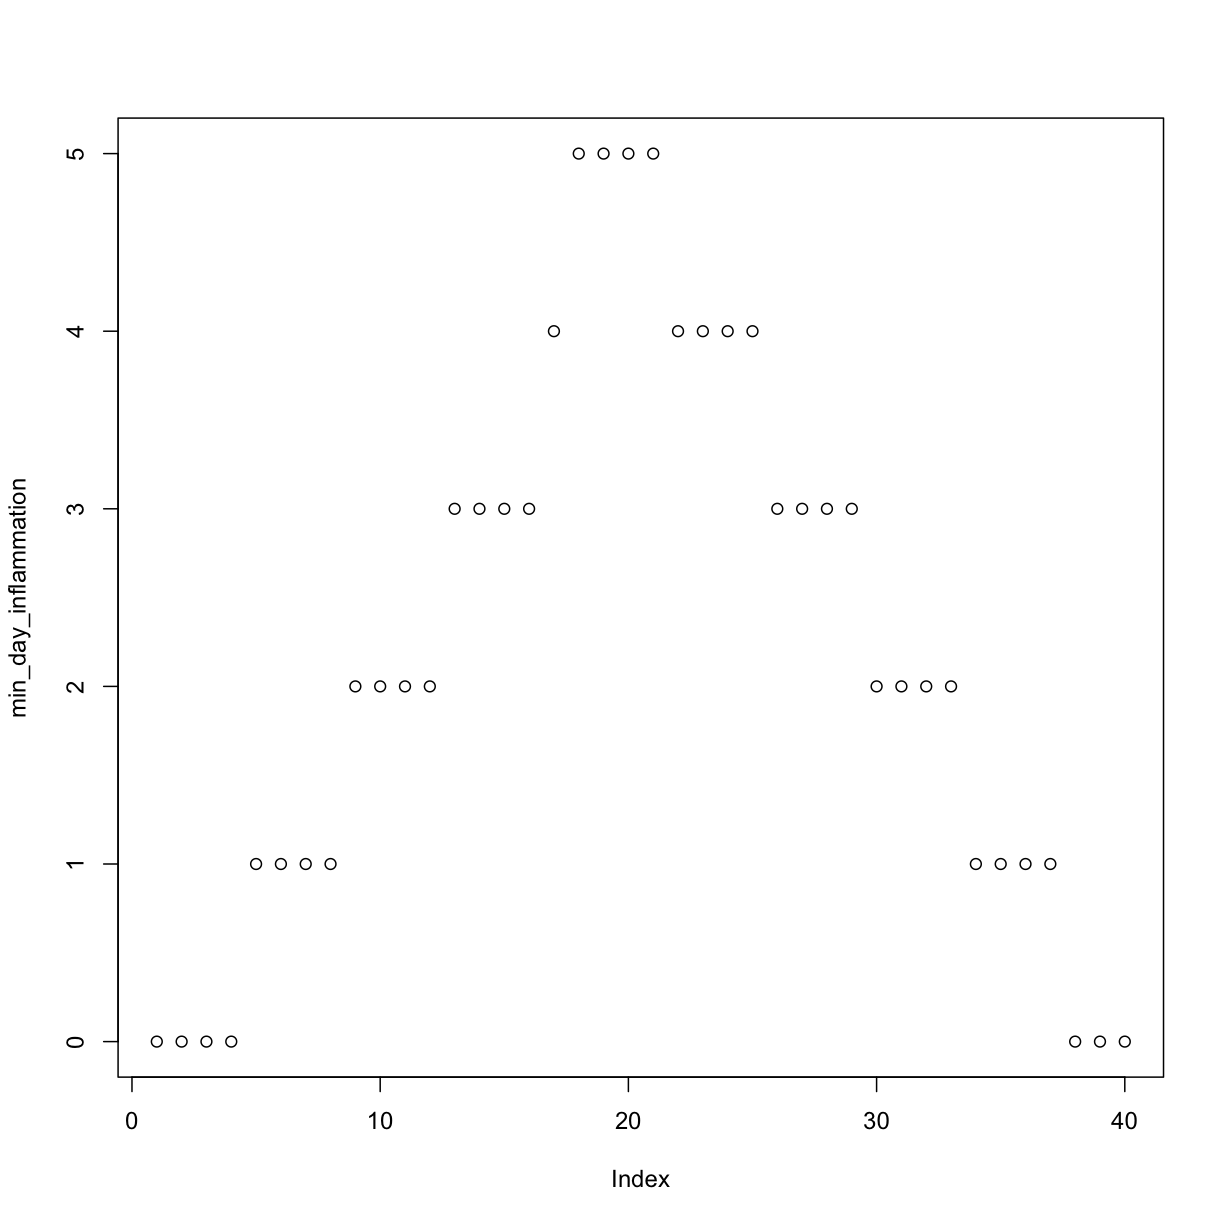
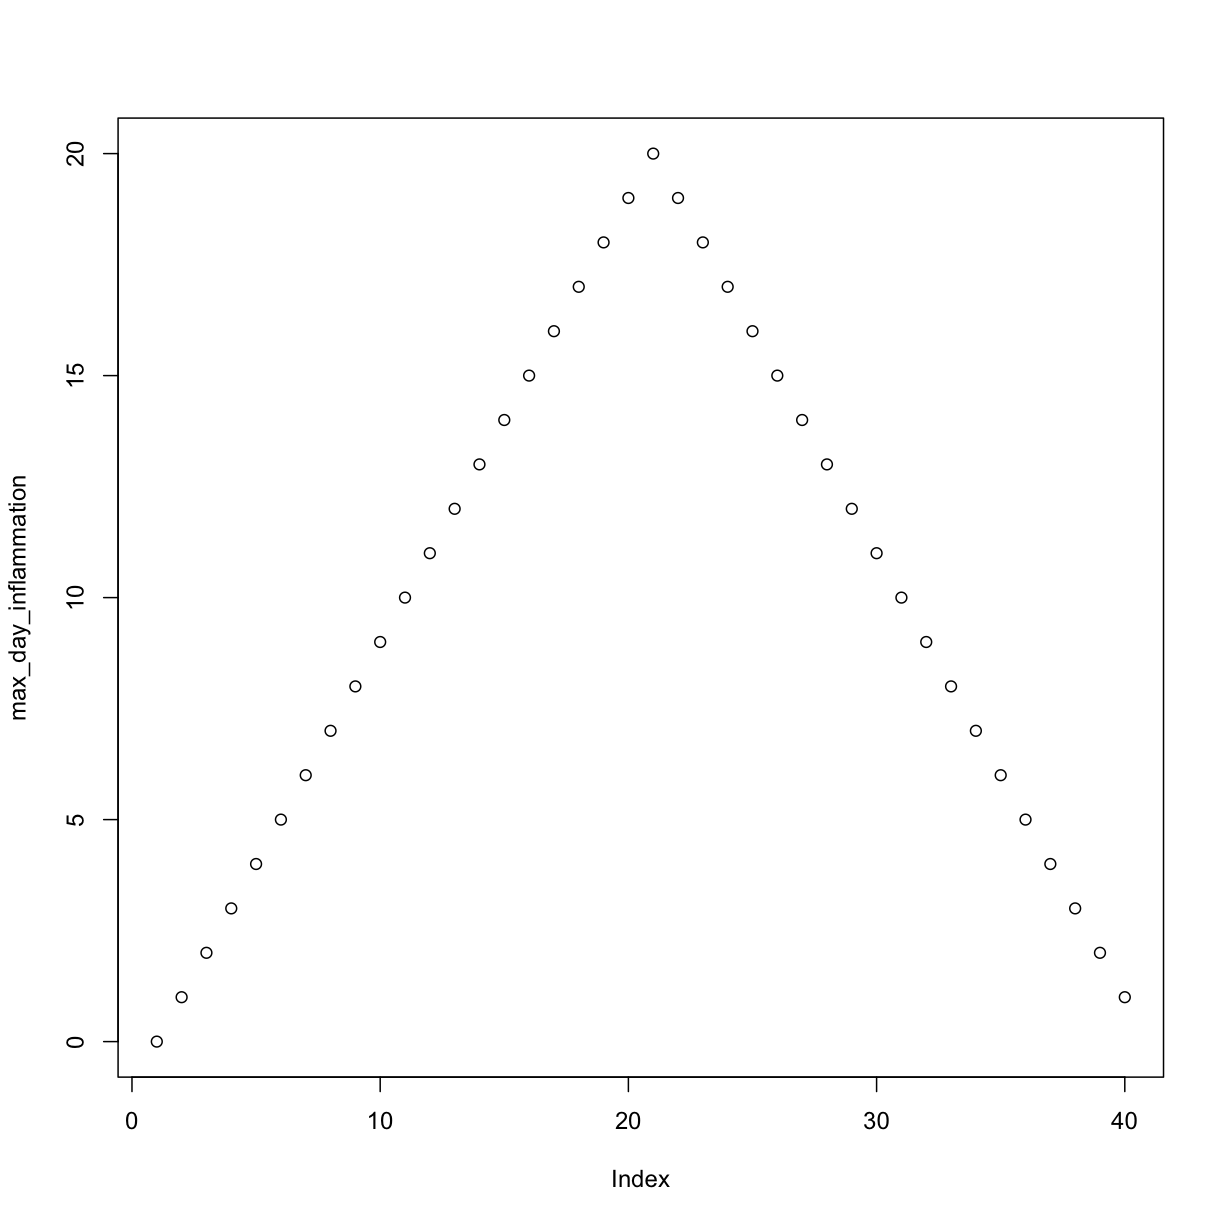
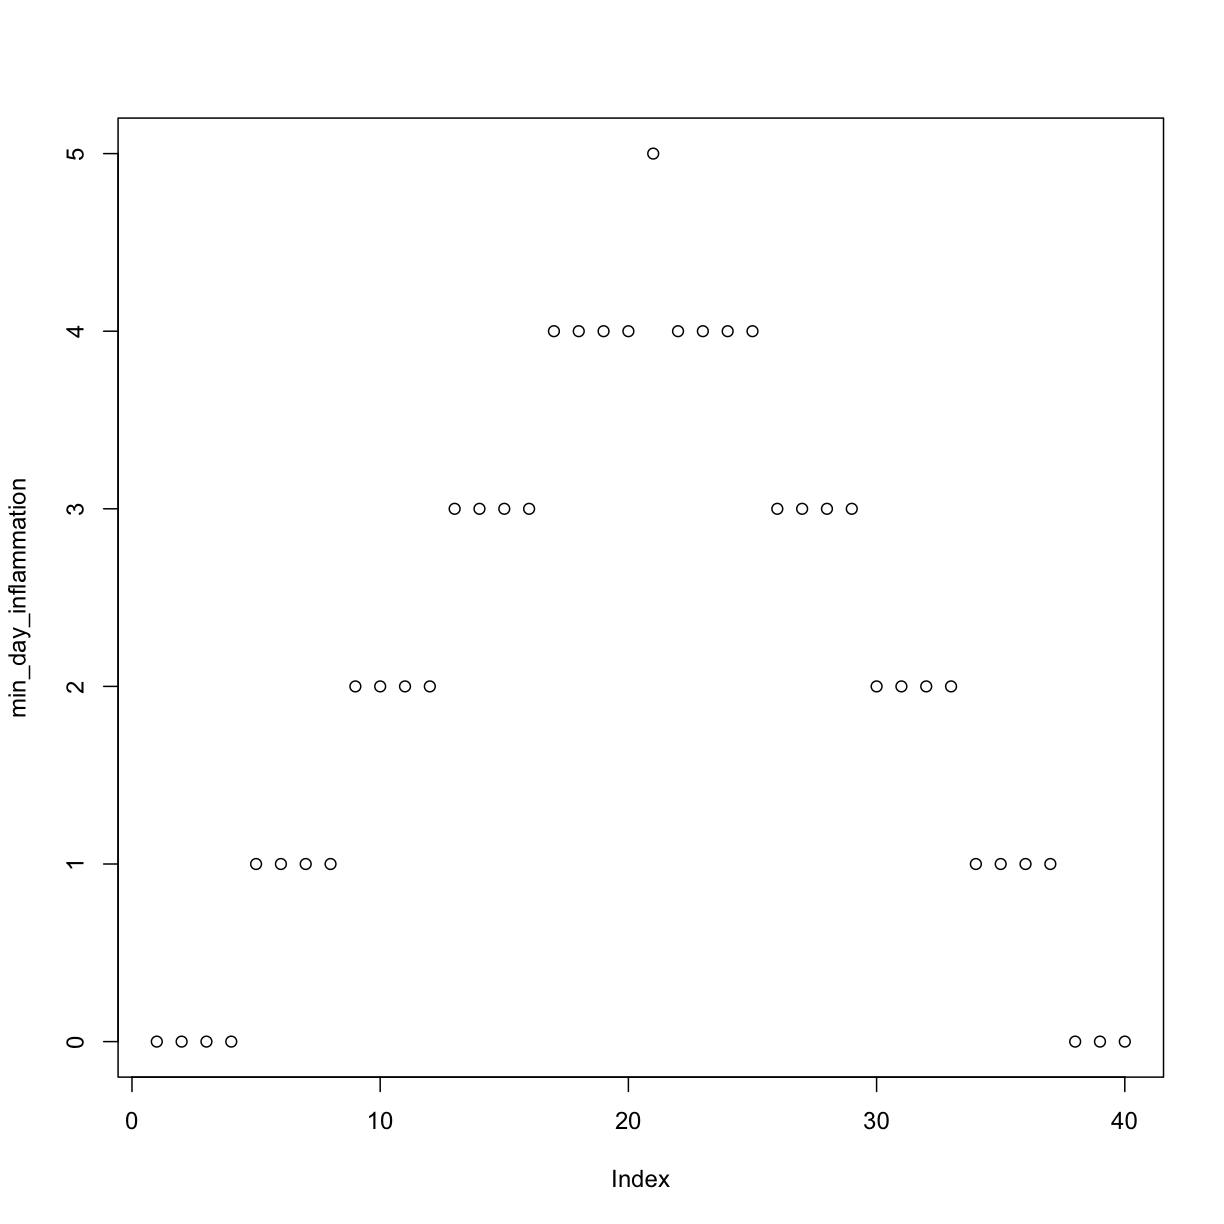
The maximum value rises and falls perfectly smoothly, while the minimum seems to be a step function. Neither result seems particularly likely, so either there’s a mistake in our calculations or something is wrong with our data.
Plotting Data
Create a plot showing the standard deviation of the inflammation data for each day across all patients.
Solution
sd_day_inflammation <- apply(dat, 2, sd)
plot(sd_day_inflammation)
Creating Functions
If we only had one data set to analyze, it would probably be faster to load the file into a spreadsheet and use that to plot some simple statistics. But we have twelve files to check, and may have more in the future. In this lesson, we’ll learn how to write a function so that we can repeat several operations with a single command.
Defining a Function
Let’s start by defining a function fahrenheit_to_kelvin that converts temperatures from Fahrenheit to Kelvin:
fahrenheit_to_kelvin <- function(temp_F) {
  temp_K <- ((temp_F - 32) * (5 / 9)) + 273.15
  return(temp_K)
}
We define fahrenheit_to_kelvin by assigning it to the output of function.
The list of argument names are contained within parentheses.
Next, the body of the function–the statements that are executed when it runs–is contained within curly braces ({}).
The statements in the body are indented by two spaces, which makes the code easier to read but does not affect how the code operates.
When we call the function, the values we pass to it are assigned to those variables so that we can use them inside the function. Inside the function, we use a return statement to send a result back to whoever asked for it.
Automatic Returns
In R, it is not necessary to include the return statement. R automatically returns whichever variable is on the last line of the body of the function. While in the learning phase, we will explicitly define the return statement.
Let’s try running our function. Calling our own function is no different from calling any other function:
# freezing point of water
fahrenheit_to_kelvin(32)
[1] 273.15
# boiling point of water
fahrenheit_to_kelvin(212)
[1] 373.15
We’ve successfully called the function that we defined, and we have access to the value that we returned.
Composing Functions
Now that we’ve seen how to turn Fahrenheit into Kelvin, it’s easy to turn Kelvin into Celsius:
kelvin_to_celsius <- function(temp_K) {
  temp_C <- temp_K - 273.15
  return(temp_C)
}

# absolute zero in Celsius
kelvin_to_celsius(0)
[1] -273.15
What about converting Fahrenheit to Celsius? We could write out the formula, but we don’t need to. Instead, we can compose the two functions we have already created:
fahrenheit_to_celsius <- function(temp_F) {
  temp_K <- fahrenheit_to_kelvin(temp_F)
  temp_C <- kelvin_to_celsius(temp_K)
  return(temp_C)
}

# freezing point of water in Celsius
fahrenheit_to_celsius(32.0)
[1] 0
This is our first taste of how larger programs are built: we define basic operations, then combine them in ever-larger chunks to get the effect we want. Real-life functions will usually be larger than the ones shown here–typically half a dozen to a few dozen lines–but they shouldn’t ever be much longer than that, or the next person who reads it won’t be able to understand what’s going on.
Nesting Functions
This example showed the output of
fahrenheit_to_kelvinassigned totemp_K, which is then passed tokelvin_to_celsiusto get the final result. It is also possible to perform this calculation in one line of code, by “nesting” one function inside another, like so:# freezing point of water in Celsius kelvin_to_celsius(fahrenheit_to_kelvin(32.0))[1] 0
Create a Function
In the last lesson, we learned to combine elements into a vector using the
cfunction, e.g.x <- c("A", "B", "C")creates a vectorxwith three elements. Furthermore, we can extend that vector again usingc, e.g.y <- c(x, "D")creates a vectorywith four elements. Write a function calledhighlightthat takes two vectors as arguments, calledcontentandwrapper, and returns a new vector that has the wrapper vector at the beginning and end of the content:best_practice <- c("Write", "programs", "for", "people", "not", "computers") asterisk <- "***" # R interprets a variable with a single value as a vector # with one element. highlight(best_practice, asterisk)[1] "***" "Write" "programs" "for" "people" "not" [7] "computers" "***"Solution
highlight <- function(content, wrapper) {
  answer <- c(wrapper, content, wrapper)
  return(answer)
}
If the variable
vrefers to a vector, thenv[1]is the vector’s first element andv[length(v)]is its last (the functionlengthreturns the number of elements in a vector). Write a function callededgesthat returns a vector made up of just the first and last elements of its input:dry_principle <- c("Don't", "repeat", "yourself", "or", "others") edges(dry_principle)[1] "Don't" "others"Solution
edges <- function(v) {
  first <- v[1]
   last <- v[length(v)]
   answer <- c(first, last)
   return(answer)
}
The Call Stack
For a deeper understanding of how functions work, you’ll need to learn how they create their own environments and call other functions. Function calls are managed via the call stack. For more details on the call stack, have a look at the supplementary material.
Named Variables and the Scope of Variables
Functions can accept arguments explicitly assigned to a variable name in the function call
functionName(variable = value), as well as arguments by order:input_1 <- 20 mySum <- function(input_1, input_2 = 10) { output <- input_1 + input_2 return(output) }
- Given the above code was run, which value does
mySum(input_1 = 1, 3)produce?
- 4
- 11
- 23
- 30
- If
mySum(3)returns 13, why doesmySum(input_2 = 3)return an error?Solution
Read the error message:
argument "input_1" is missing, with no defaultmeans that no value forinput_1is provided in the function call, and neither in the function’s defintion. Thus, the addition in the function body can not be completed.
Testing and Documenting
Once we start putting things in functions so that we can re-use them, we need to start testing that those functions are working correctly. To see how to do this, let’s write a function to center a dataset around a particular midpoint:
center <- function(data, midpoint) {
  new_data <- (data - mean(data)) + midpoint
}
We could test this on our actual data, but since we don’t know what the values ought to be, it will be hard to tell if the result was correct. Instead, let’s create a vector of 0s and then center that around 3. This will make it simple to see if our function is working as expected:
z <- c(0, 0, 0, 0)
z
[1] 0 0 0 0
center(z, 3)
That looks right, so let’s try center on our real data. We’ll center the inflammation data from day 4 around 0:
dat <- read.csv(file = "inflammation-01.csv", header = FALSE)
centered <- center(dat[, 4], 0)
head(centered)
[1] 1.25 -0.75 1.25 -1.75 1.25 0.25
It’s hard to tell from the default output whether the result is correct, but there are a few simple tests that will reassure us:
# original min
min(dat[, 4])
[1] 0
# original mean
mean(dat[, 4])
[1] 1.75
# original max
max(dat[, 4])
[1] 3
# centered min
min(centered)
[1] -1.75
# centered mean
mean(centered)
[1] 0
# centered max
max(centered)
[1] 1.25
That seems almost right: the original mean was about 1.75, so the lower bound from zero is now about -1.75. The mean of the centered data is 0. We can even go further and check that the standard deviation hasn’t changed:
# original standard deviation
sd(dat[, 4])
[1] 1.067628
# centered standard deviation
sd(centered)
[1] 1.067628
Those values look the same, but we probably wouldn’t notice if they were different in the sixth decimal place. Let’s do this instead:
# difference in standard deviations before and after
sd(dat[, 4]) - sd(centered)
[1] 0
Sometimes, a very small difference can be detected due to rounding at very low decimal places.
R has a useful function for comparing two objects allowing for rounding errors, all.equal:
all.equal(sd(dat[, 4]), sd(centered))
[1] TRUE
It’s still possible that our function is wrong, but it seems unlikely enough that we should probably get back to doing our analysis. We have one more task first, though: we should write some documentation for our function to remind ourselves later what it’s for and how to use it.
A common way to put documentation in software is to add comments like this:
center <- function(data, midpoint) {
  # return a new vector containing the original data centered around the
  # midpoint.
  # Example: center(c(1, 2, 3), 0) => c(-1, 0, 1)
  new_data <- (data - mean(data)) + midpoint
  return(new_data)
}
Writing Documentation
Formal documentation for R functions is written in separate
.Rdusing a markup language similar to LaTeX. You see the result of this documentation when you look at the help file for a given function, e.g.?read.csv. The roxygen2 package allows R coders to write documentation alongside the function code and then process it into the appropriate.Rdfiles. You will want to switch to this more formal method of writing documentation when you start writing more complicated R projects.
Functions to Create Graphs
Write a function called
analyzethat takes a filename as an argument and displays the three graphs produced in the previous lesson (average, min and max inflammation over time).analyze("inflammation-01.csv")should produce the graphs already shown, whileanalyze("inflammation-02.csv")should produce corresponding graphs for the second data set. Be sure to document your function with comments.Solution
analyze <- function(filename) {
  # Plots the average, min, and max inflammation over time.
  # Input is character string of a csv file.
  dat <- read.csv(file = filename, header = FALSE)
  avg_day_inflammation <- apply(dat, 2, mean)
  plot(avg_day_inflammation)
  max_day_inflammation <- apply(dat, 2, max)
  plot(max_day_inflammation)
  min_day_inflammation <- apply(dat, 2, min)
  plot(min_day_inflammation)
}
Rescaling
Write a function
rescalethat takes a vector as input and returns a corresponding vector of values scaled to lie in the range 0 to 1. (IfLandHare the lowest and highest values in the original vector, then the replacement for a valuevshould be(v-L) / (H-L).) Be sure to document your function with comments.Test that your
rescalefunction is working properly usingmin,max, andplot.Solution
rescale <- function(v) {
  # Rescales a vector, v, to lie in the range 0 to 1.
  L <- min(v)
  H <- max(v)
  result <- (v - L) / (H - L)
  return(result)
}
Defining Defaults
We have passed arguments to functions in two ways: directly, as in dim(dat), and by name, as in read.csv(file = "inflammation-01.csv", header = FALSE).
In fact, we can pass the arguments to read.csv without naming them:
dat <- read.csv("inflammation-01.csv", FALSE)
However, the position of the arguments matters if they are not named.
dat <- read.csv(header = FALSE, file = "inflammation-01.csv")
dat <- read.csv(FALSE, "inflammation-01.csv")
Error in read.table(file = file, header = header, sep = sep, quote = quote, : 'file' must be a character string or connection
To understand what’s going on, and make our own functions easier to use, let’s re-define our center function like this:
center <- function(data, midpoint = 0) {
  # return a new vector containing the original data centered around the
  # midpoint (0 by default).
  # Example: center(c(1, 2, 3), 0) => c(-1, 0, 1)
  new_data <- (data - mean(data)) + midpoint
  return(new_data)
}
The key change is that the second argument is now written midpoint = 0 instead of just midpoint.
If we call the function with two arguments, it works as it did before:
test_data <- c(0, 0, 0, 0)
center(test_data, 3)
[1] 3 3 3 3
But we can also now call center() with just one argument, in which case midpoint is automatically assigned the default value of 0:
more_data <- 5 + test_data
more_data
[1] 5 5 5 5
center(more_data)
[1] 0 0 0 0
This is handy: if we usually want a function to work one way, but occasionally need it to do something else, we can allow people to pass an argument when they need to but provide a default to make the normal case easier.
The example below shows how R matches values to arguments
display <- function(a = 1, b = 2, c = 3) {
  result <- c(a, b, c)
  names(result) <- c("a", "b", "c")  # This names each element of the vector
  return(result)
}

# no arguments
display()
a b c
1 2 3
# one argument
display(55)
 a  b  c
55  2  3
# two arguments
display(55, 66)
 a  b  c
55 66  3
# three arguments
display(55, 66, 77)
 a  b  c
55 66 77
As this example shows, arguments are matched from left to right, and any that haven’t been given a value explicitly get their default value. We can override this behavior by naming the value as we pass it in:
# only setting the value of c
display(c = 77)
 a  b  c
 1  2 77
Matching Arguments
To be precise, R has three ways that arguments supplied by you are matched to the formal arguments of the function definition:
- by complete name,
- by partial name (matching on initial n characters of the argument name), and
- by position.
Arguments are matched in the manner outlined above in that order: by complete name, then by partial matching of names, and finally by position.
With that in hand, let’s look at the help for read.csv():
?read.csv
There’s a lot of information there, but the most important part is the first couple of lines:
read.csv(file, header = TRUE, sep = ",", quote = "\"",
         dec = ".", fill = TRUE, comment.char = "", ...)
This tells us that read.csv() has one argument, file, that doesn’t have a default value, and six others that do.
Now we understand why the following gives an error:
dat <- read.csv(FALSE, "inflammation-01.csv")
Error in read.table(file = file, header = header, sep = sep, quote = quote, : 'file' must be a character string or connection
It fails because FALSE is assigned to file and the filename is assigned to the argument header.
A Function with Default Argument Values
Rewrite the
rescalefunction so that it scales a vector to lie between 0 and 1 by default, but will allow the caller to specify lower and upper bounds if they want. Compare your implementation to your neighbor’s: Do your two implementations produce the same results when both are given the same input vector and parameters?Solution
rescale <- function(v, lower = 0, upper = 1) {
  # Rescales a vector, v, to lie in the range lower to upper.
  L <- min(v)
  H <- max(v)
  result <- (v - L) / (H - L) * (upper - lower) + lower
  return(result)
}
Analyzing Multiple Data Sets
We have created a function called analyze that creates graphs of the minimum, average, and maximum daily inflammation rates for a single data set:
analyze <- function(filename) {
  # Plots the average, min, and max inflammation over time.
  # Input is character string of a csv file.
  dat <- read.csv(file = filename, header = FALSE)
  avg_day_inflammation <- apply(dat, 2, mean)
  plot(avg_day_inflammation)
  max_day_inflammation <- apply(dat, 2, max)
  plot(max_day_inflammation)
  min_day_inflammation <- apply(dat, 2, min)
  plot(min_day_inflammation)
}

analyze("inflammation-01.csv")
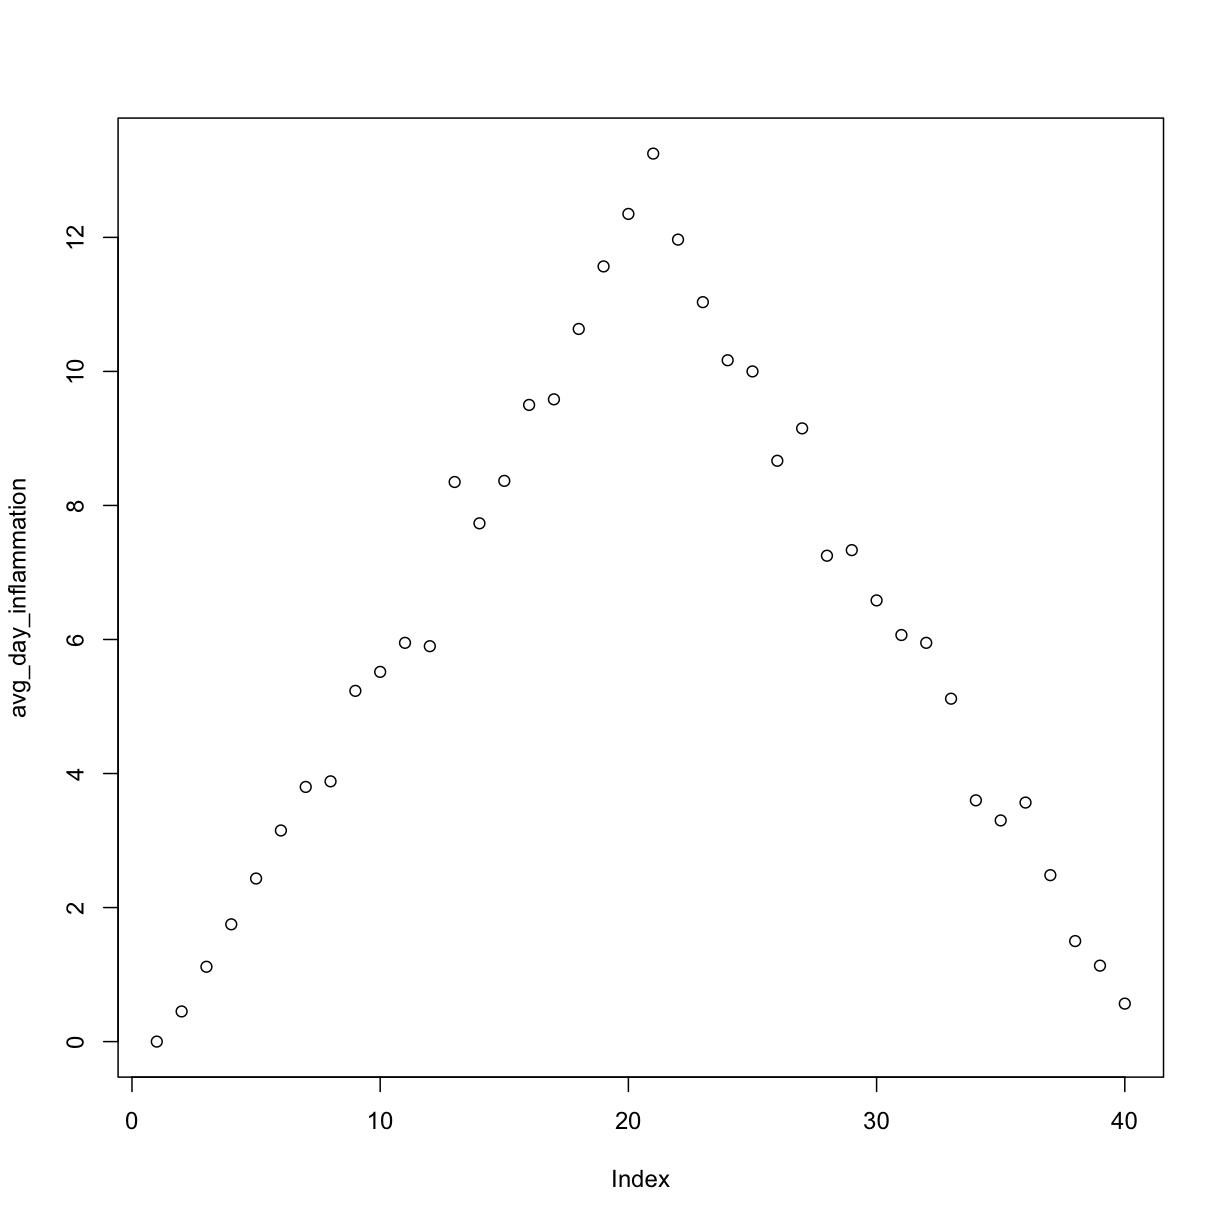
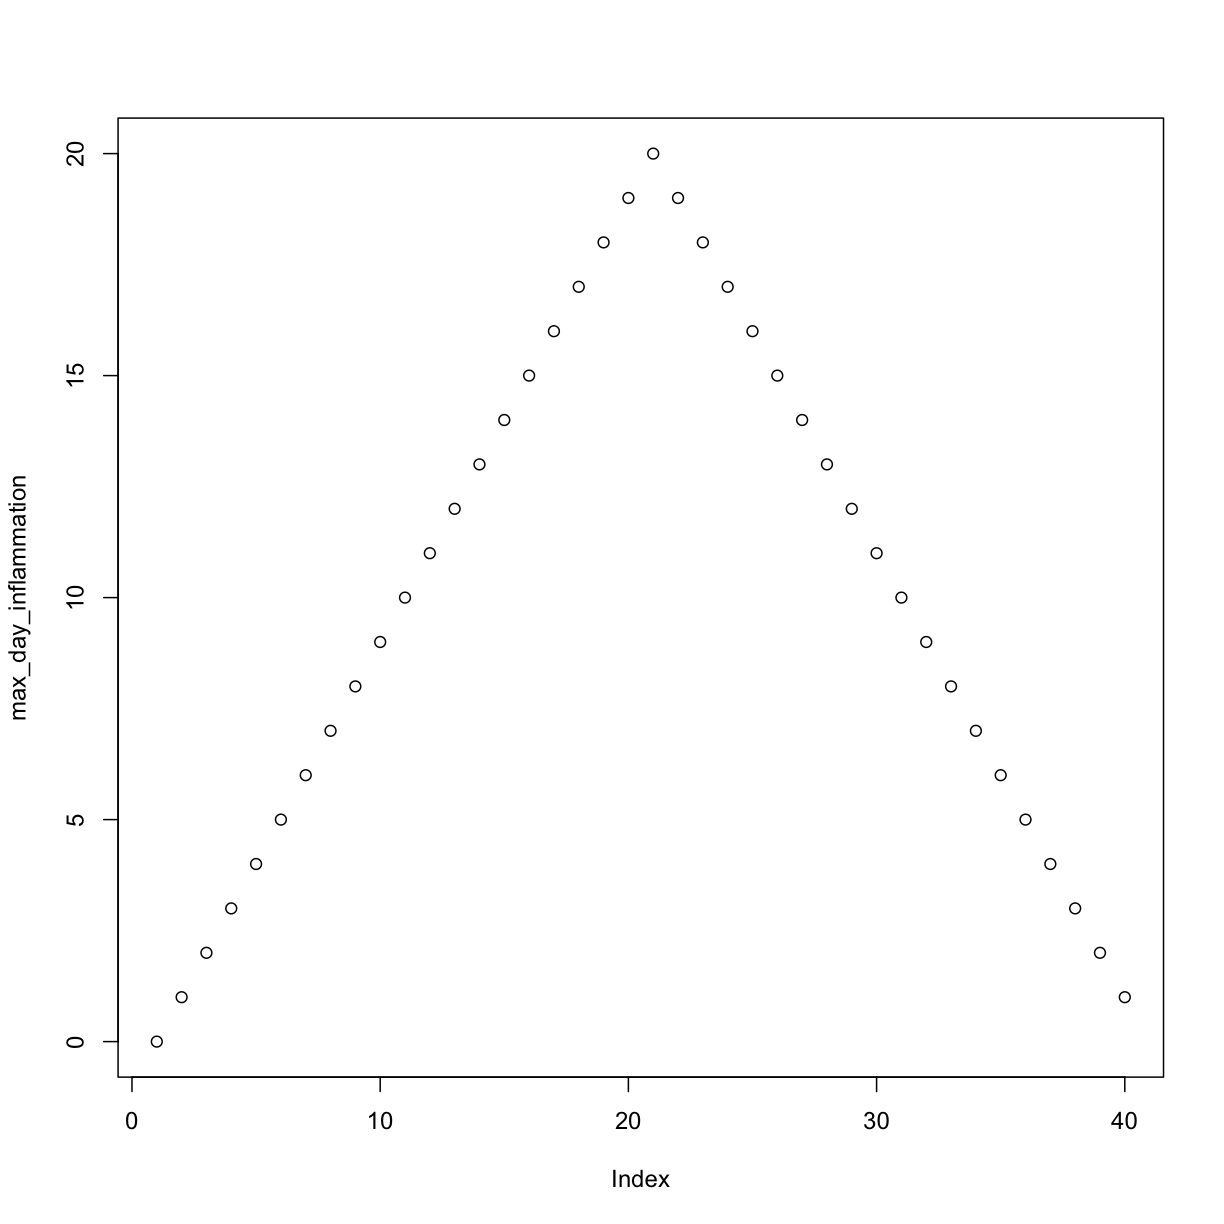
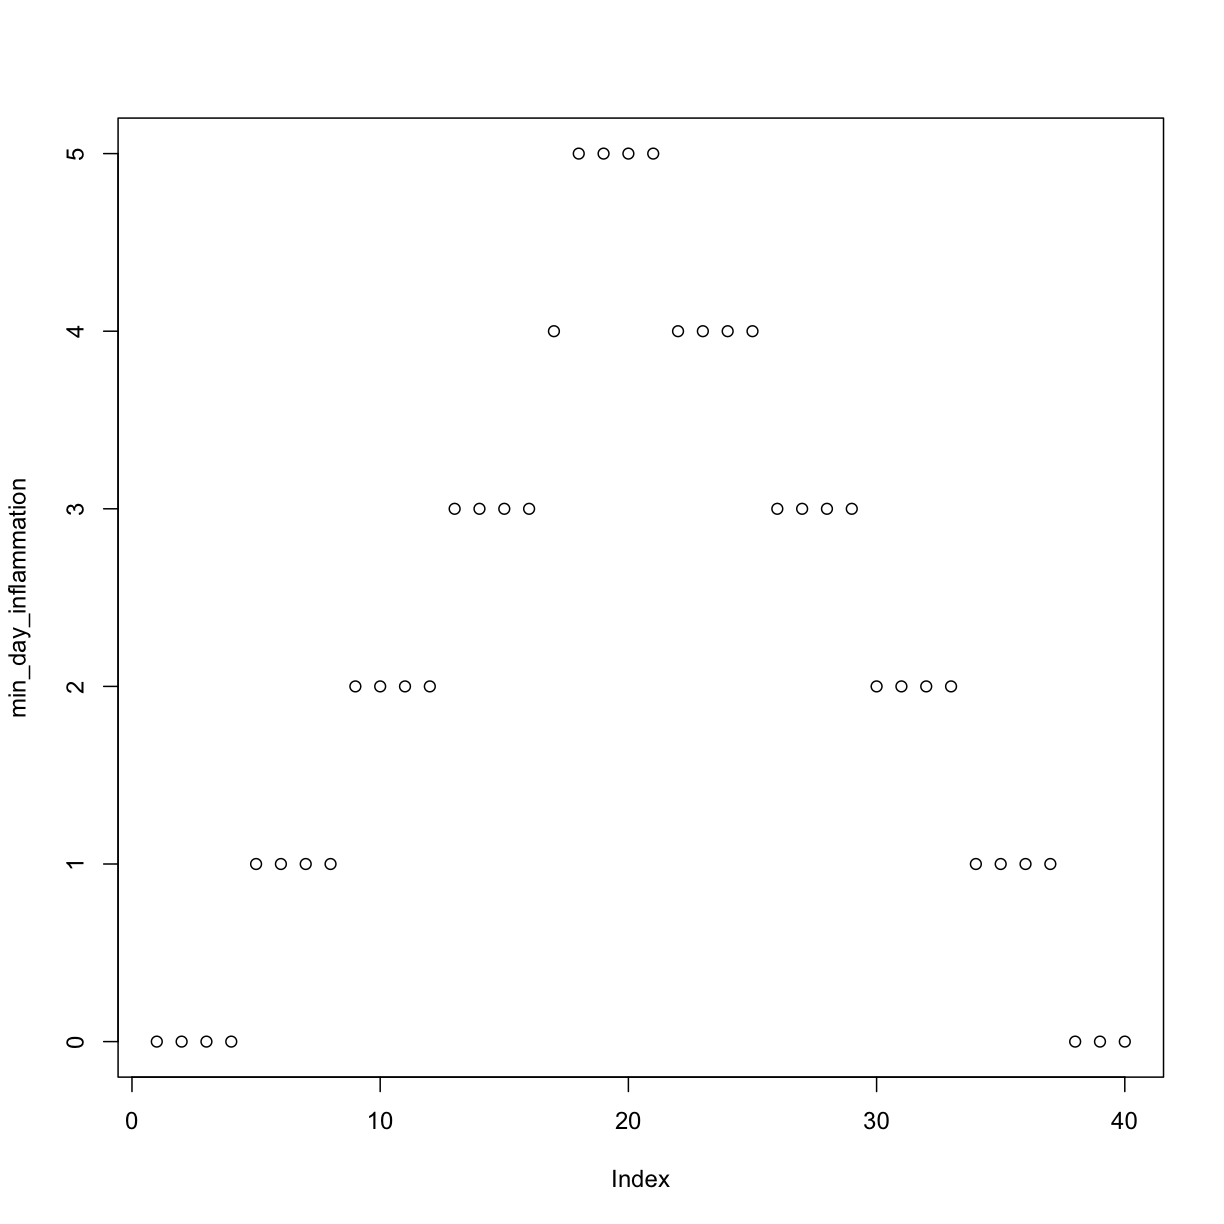
We can use it to analyze other data sets one by one:
analyze("inflammation-02.csv")
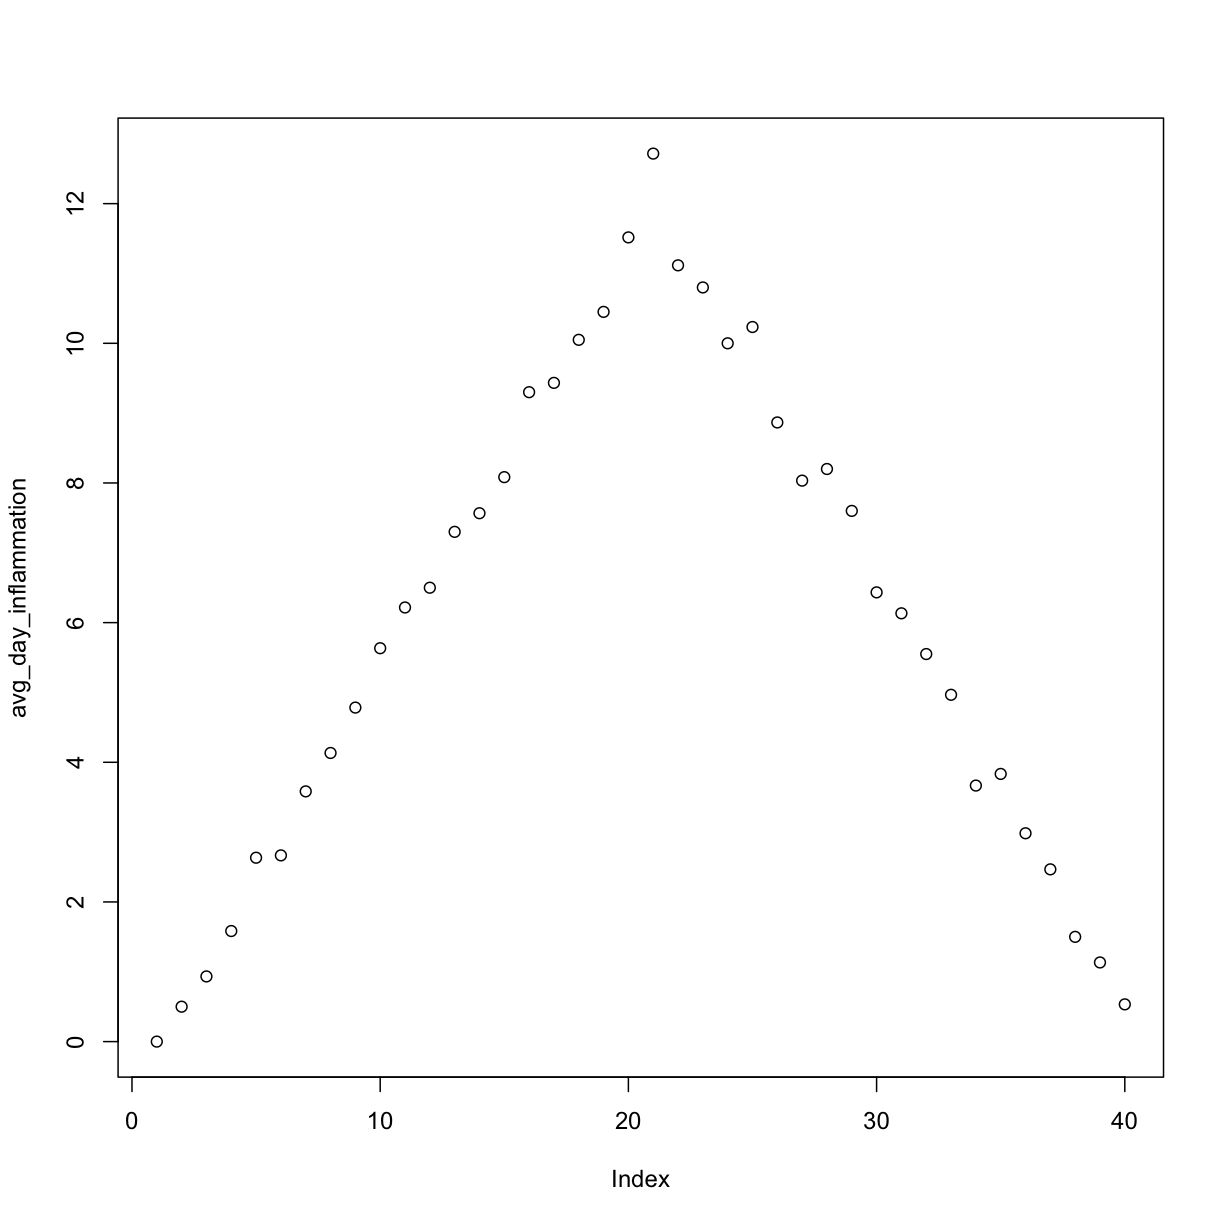
but we have a dozen data sets right now and more on the way. We want to create plots for all our data sets with a single statement. To do that, we’ll have to teach the computer how to repeat things.
For Loops
Suppose we want to print each word in a sentence.
One way is to use six print statements:
best_practice <- c("Let", "the", "computer", "do", "the", "work")
print_words <- function(sentence) {
  print(sentence[1])
  print(sentence[2])
  print(sentence[3])
  print(sentence[4])
  print(sentence[5])
  print(sentence[6])
}

print_words(best_practice)
[1] "Let"
[1] "the"
[1] "computer"
[1] "do"
[1] "the"
[1] "work"
but that’s a bad approach for two reasons:
-
It doesn’t scale: if we want to print the elements in a vector that’s hundreds long, we’d be better off just typing them in.
-
It’s fragile: if we give it a longer vector, it only prints part of the data, and if we give it a shorter input, it returns
NAvalues because we’re asking for elements that don’t exist!
best_practice[-6]
[1] "Let" "the" "computer" "do" "the"
print_words(best_practice[-6])
[1] "Let"
[1] "the"
[1] "computer"
[1] "do"
[1] "the"
[1] NA
Not Available
R has has a special variable,
NA, for designating missing values that are Not Available in a data set. See?NAand An Introduction to R for more details.
Here’s a better approach:
print_words <- function(sentence) {
  for (word in sentence) {
    print(word)
  }
}

print_words(best_practice)
[1] "Let"
[1] "the"
[1] "computer"
[1] "do"
[1] "the"
[1] "work"
This is shorter - certainly shorter than something that prints every character in a hundred-letter string - and more robust as well:
print_words(best_practice[-6])
[1] "Let"
[1] "the"
[1] "computer"
[1] "do"
[1] "the"
The improved version of print_words uses a for loop to repeat an operation—in this case, printing—once for each thing in a collection.
The general form of a loop is:
for (variable in collection) {
  do things with variable
}
We can name the loop variable anything we like (with a few restrictions, e.g. the name of the variable cannot start with a digit).
in is part of the for syntax.
Note that the condition (variable in collection) is enclosed in parentheses,
and the body of the loop is enclosed in curly braces { }.
For a single-line loop body, as here, the braces aren’t needed, but it is good practice to include them as we did.
Here’s another loop that repeatedly updates a variable:
len <- 0
vowels <- c("a", "e", "i", "o", "u")
for (v in vowels) {
  len <- len + 1
}
# Number of vowels
len
[1] 5
It’s worth tracing the execution of this little program step by step.
Since there are five elements in the vector vowels, the statement inside the loop will be executed five times.
The first time around, len is zero (the value assigned to it on line 1) and v is "a".
The statement adds 1 to the old value of len, producing 1, and updates len to refer to that new value.
The next time around, v is "e" and len is 1, so len is updated to be 2.
After three more updates, len is 5; since there is nothing left in the vector vowels for R to process, the loop finishes.
Note that a loop variable is just a variable that’s being used to record progress in a loop. It still exists after the loop is over, and we can re-use variables previously defined as loop variables as well:
letter <- "z"
for (letter in c("a", "b", "c")) {
  print(letter)
}
[1] "a"
[1] "b"
[1] "c"
# after the loop, letter is
letter
[1] "c"
Note also that finding the length of a vector is such a common operation that R actually has a built-in function to do it called length:
length(vowels)
[1] 5
length is much faster than any R function we could write ourselves, and much easier to read than a two-line loop; it will also give us the length of many other things that we haven’t met yet, so we should always use it when we can (see this lesson to learn more about the different ways to store data in R).
Printing Numbers
R has a built-in function called
seqthat creates a list of numbers:seq(3)[1] 1 2 3Using
seq, write a function that prints the first N natural numbers, one per line:print_N(3)[1] 1 [1] 2 [1] 3Solution
print_N <- function(N) {
  nseq <- seq(N)
  for (num in nseq) {
    print(num)
  }
}
Summing Values
Write a function called
totalthat calculates the sum of the values in a vector. (R has a built-in function calledsumthat does this for you. Please don’t use it for this exercise.)ex_vec <- c(4, 8, 15, 16, 23, 42) total(ex_vec)[1] 108Solution
total <- function(vec) {
  # calculates the sum of the values in a vector
  vec_sum <- 0
  for (num in vec) {
    vec_sum <- vec_sum + num
  }
  return(vec_sum)
}
Exponentiation
Exponentiation is built into R:
2^4[1] 16Write a function called
expothat uses a loop to calculate the same result.expo(2, 4)[1] 16Solution
expo <- function(base, power) {
  result <- 1
  for (i in seq(power)) {
    result <- result * base
  }
  return(result)
}
Processing Multiple Files
We now have almost everything we need to process all our data files.
The only thing that’s missing is a function that finds files whose names match a pattern.
We do not need to write it ourselves because R already has a function to do this called list.files.
If we run the function without any arguments, list.files(), it returns every file in the current working directory.
We can understand this result by reading the help file (?list.files).
The first argument, path, is the path to the directory to be searched, and it has the default value of "."
(recall from the lesson on the Unix Shell that "." is shorthand for the current working directory).
The second argument, pattern, is the pattern being searched, and it has the default value of NULL.
Since no pattern is specified to filter the files, all files are returned.
So to list all the csv files, we could run either of the following:
list.files(path = "data", pattern = "csv")
 [1] "car-speeds-cleaned.csv" "car-speeds.csv"
 [3] "inflammation-01.csv"    "inflammation-02.csv"
 [5] "inflammation-03.csv"    "inflammation-04.csv"
 [7] "inflammation-05.csv"    "inflammation-06.csv"
 [9] "inflammation-07.csv"    "inflammation-08.csv"
[11] "inflammation-09.csv"    "inflammation-10.csv"
[13] "inflammation-11.csv"    "inflammation-12.csv"
[15] "sample.csv"             "small-01.csv"
[17] "small-02.csv"           "small-03.csv"
list.files(path = "data", pattern = "inflammation")
 [1] "inflammation-01.csv" "inflammation-02.csv" "inflammation-03.csv"
 [4] "inflammation-04.csv" "inflammation-05.csv" "inflammation-06.csv"
 [7] "inflammation-07.csv" "inflammation-08.csv" "inflammation-09.csv"
[10] "inflammation-10.csv" "inflammation-11.csv" "inflammation-12.csv"
Organizing Larger Projects
For larger projects, it is recommended to organize separate parts of the analysis into multiple subdirectories, e.g. one subdirectory for the raw data, one for the code, and one for the results like figures. We have done that here to some extent, putting all of our data files into the subdirectory “data”. For more advice on this topic, you can read A quick guide to organizing computational biology projects by William Stafford Noble.
As these examples show, list.files result is a vector of strings, which means we can loop over it to do something with each filename in turn.
In our case, the “something” we want is our analyze function.
Because we have put our data in a separate subdirectory, if we want to access these files
using the output of list.files we also need to include the “path” portion of the file name.
We can do that by using the argument full.names = TRUE.
list.files(path = "data", pattern = "csv", full.names = TRUE)
 [1] "data/car-speeds-cleaned.csv" "data/car-speeds.csv"
 [3] "inflammation-01.csv"    "inflammation-02.csv"
 [5] "inflammation-03.csv"    "inflammation-04.csv"
 [7] "inflammation-05.csv"    "inflammation-06.csv"
 [9] "inflammation-07.csv"    "inflammation-08.csv"
[11] "inflammation-09.csv"    "inflammation-10.csv"
[13] "inflammation-11.csv"    "inflammation-12.csv"
[15] "data/sample.csv"             "data/small-01.csv"
[17] "data/small-02.csv"           "data/small-03.csv"
list.files(path = "data", pattern = "inflammation", full.names = TRUE)
 [1] "inflammation-01.csv" "inflammation-02.csv"
 [3] "inflammation-03.csv" "inflammation-04.csv"
 [5] "inflammation-05.csv" "inflammation-06.csv"
 [7] "inflammation-07.csv" "inflammation-08.csv"
 [9] "inflammation-09.csv" "inflammation-10.csv"
[11] "inflammation-11.csv" "inflammation-12.csv"
Let’s test out running our analyze function by using it on the first three files in the vector returned by list.files:
filenames <- list.files(path = "data",
                        # Now follows a regular expression that matches:
                        pattern = "inflammation-[0-9]{2}.csv",
                        #          |            |        the standard file extension of comma-separated values
                        #          |            the variable parts (two digits, each between 0 and 9)
                        #          the static part of the filenames
                        full.names = TRUE)
filenames <- filenames[1:3]
for (f in filenames) {
  print(f)
  analyze(f)
}
[1] "inflammation-01.csv"
[1] "inflammation-02.csv"
[1] "inflammation-03.csv"
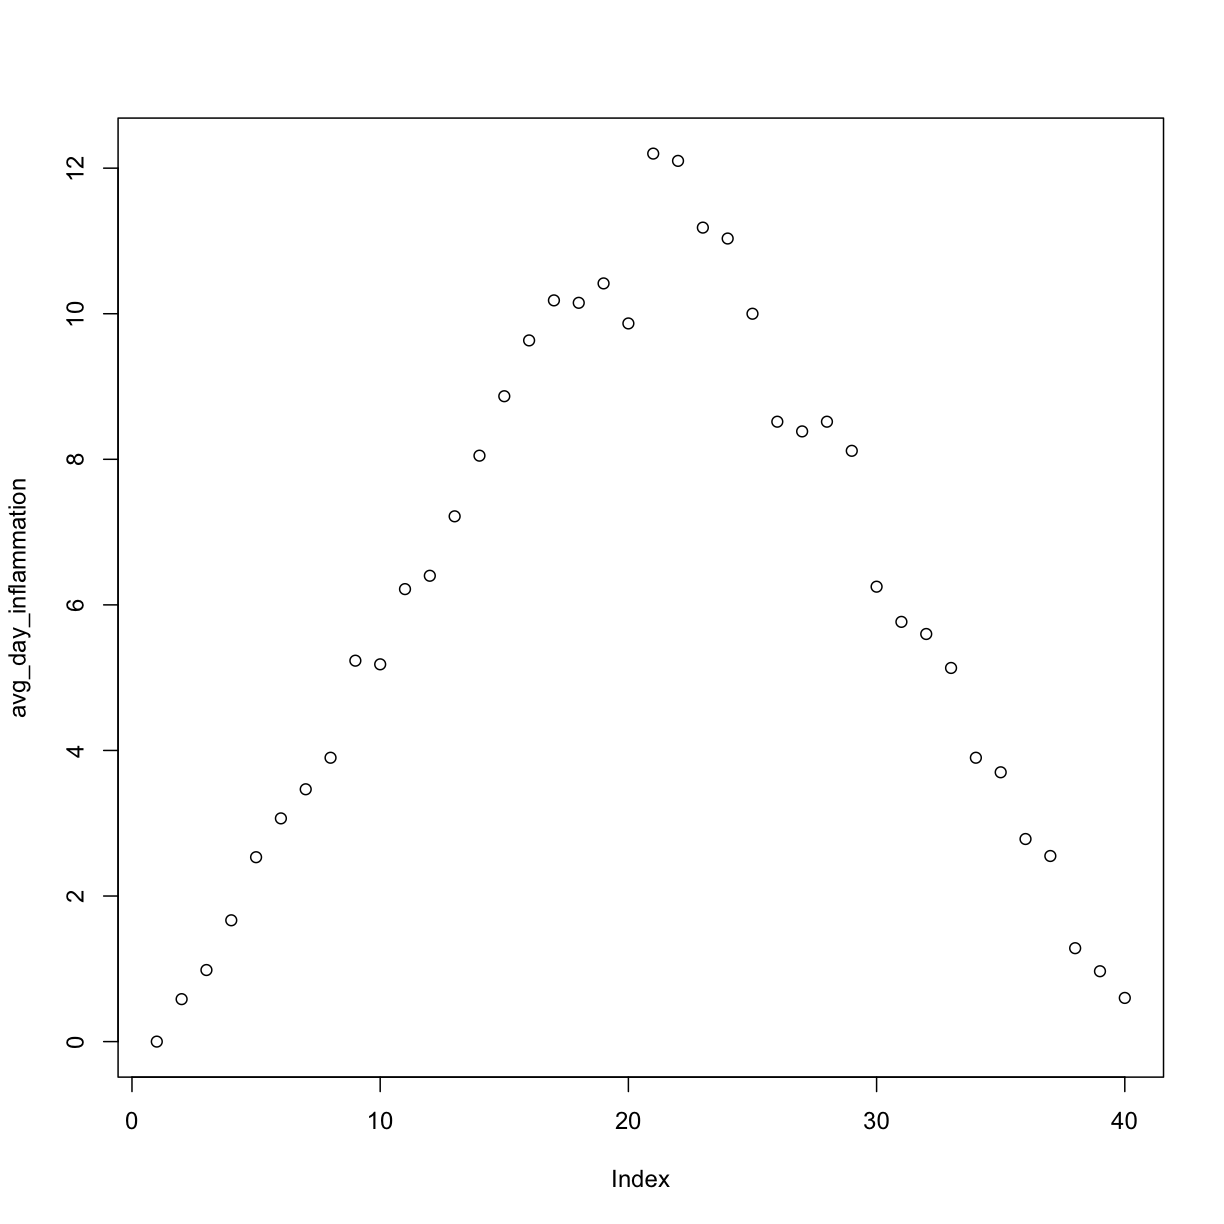
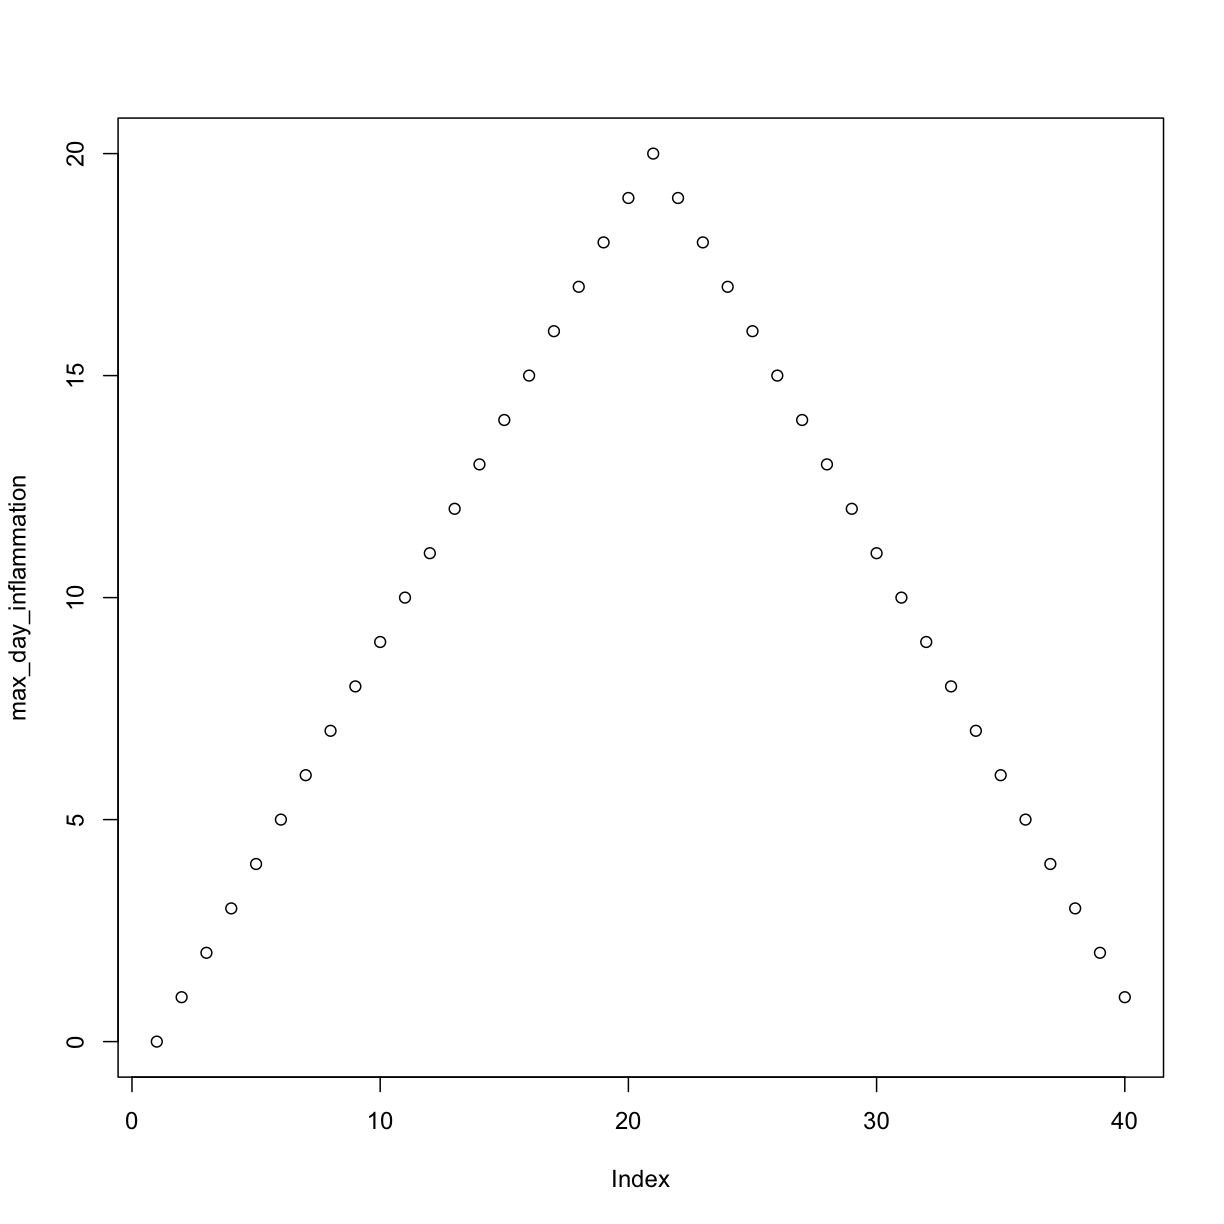
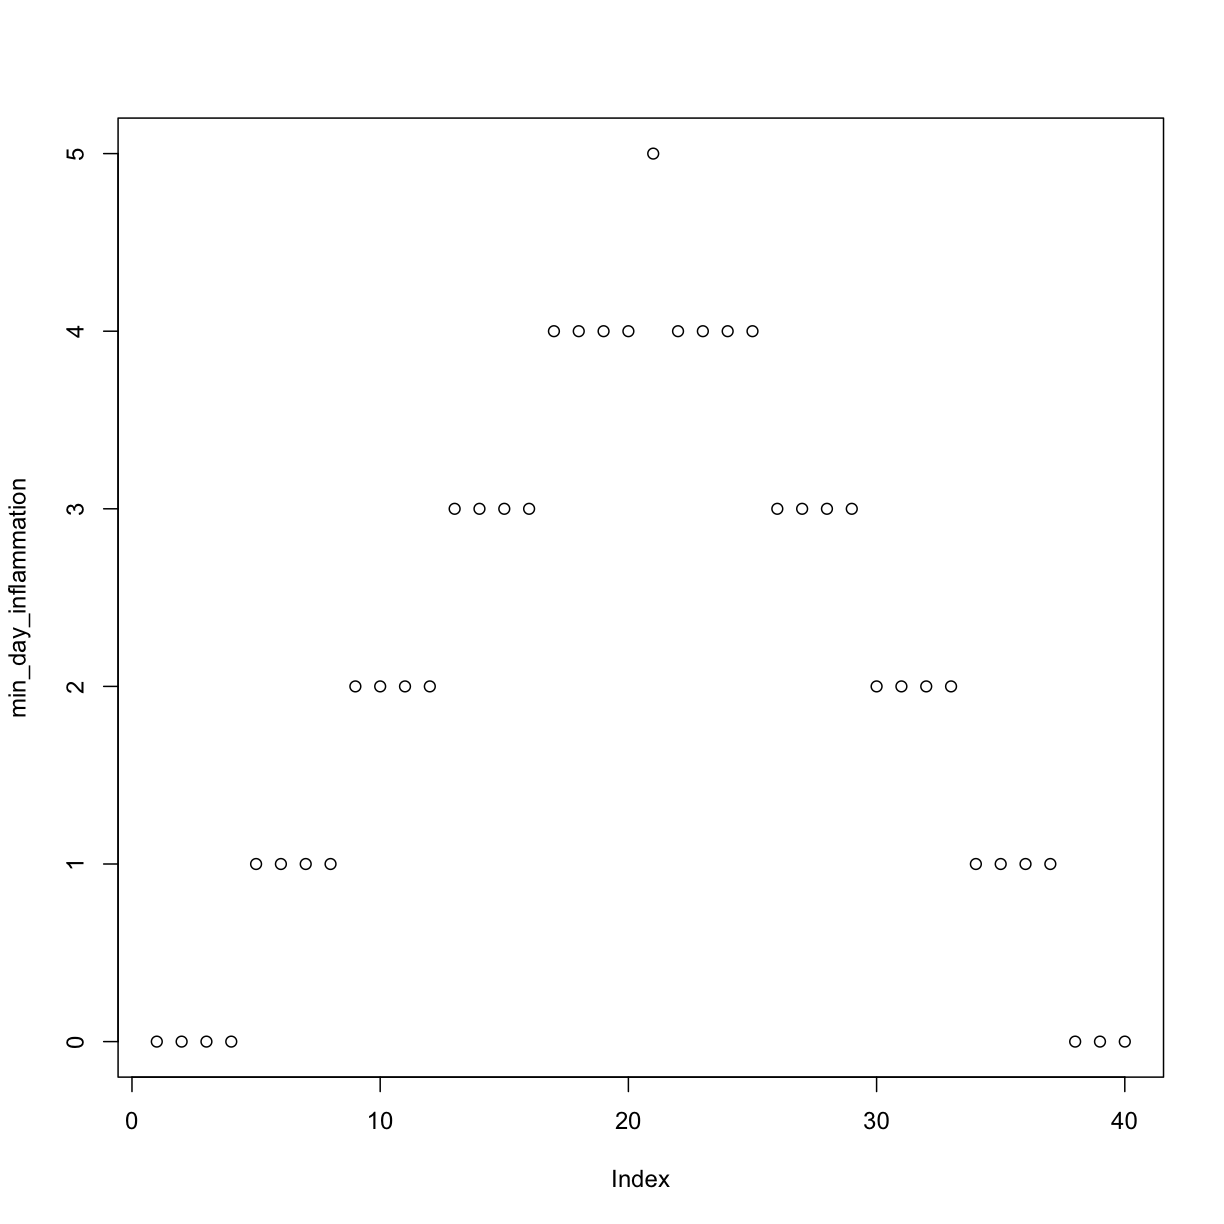
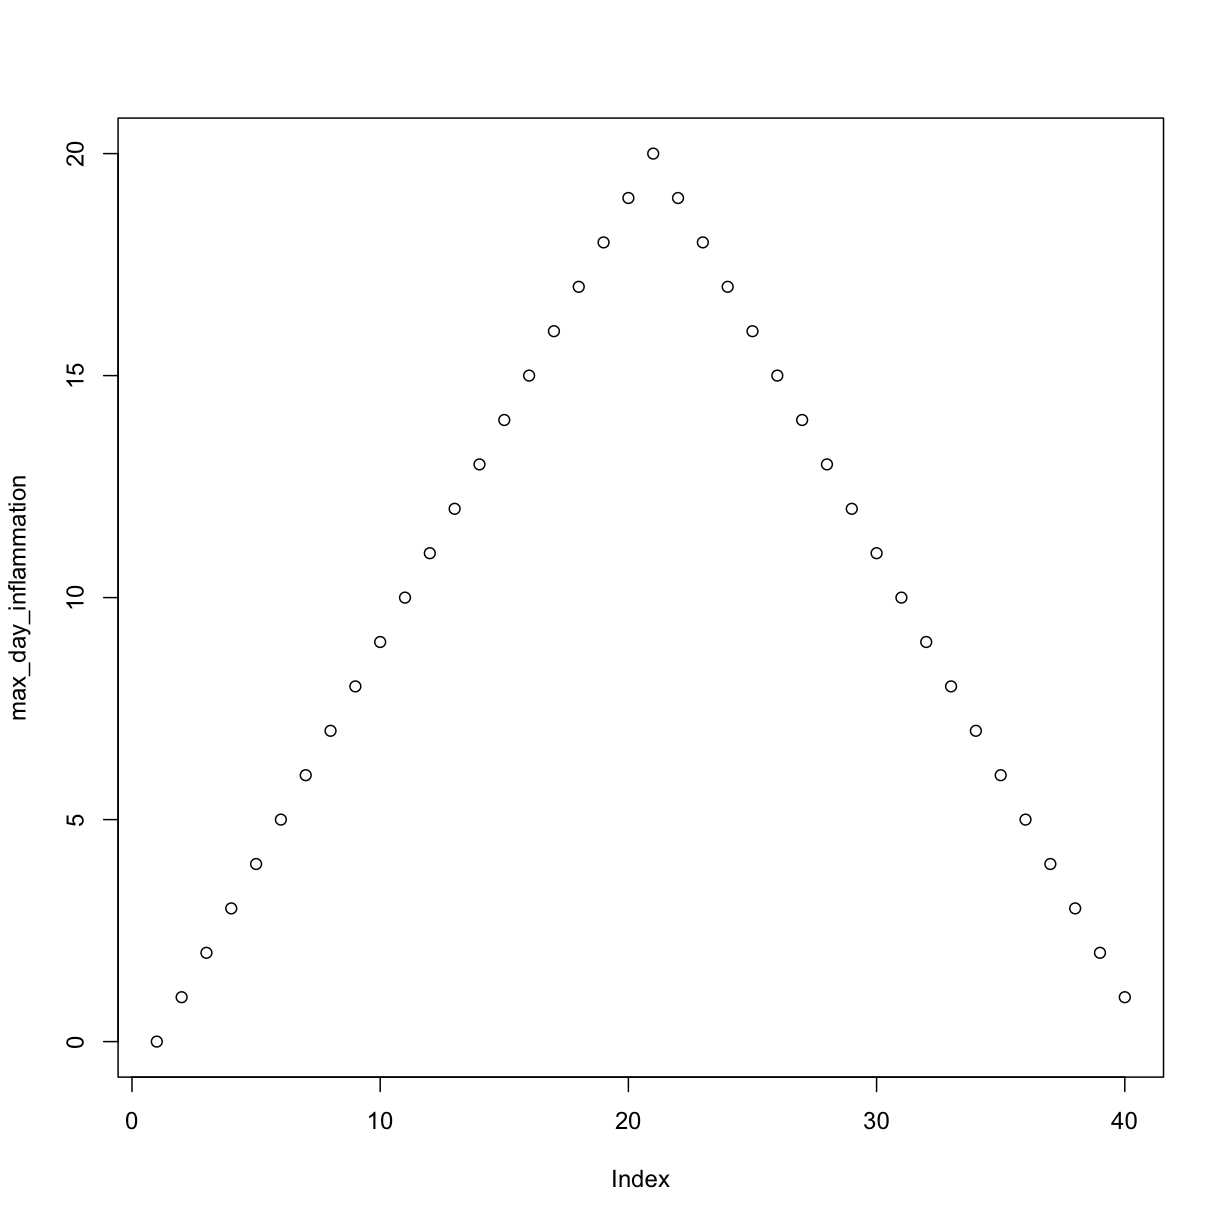
Sure enough, the maxima of these data sets show exactly the same ramp as the first, and their minima show the same staircase structure.
Other Ways to Do It
In this lesson we saw how to use a simple
forloop to repeat an operation. As you progress with R, you will learn that there are multiple ways to accomplish this. Sometimes the choice of one method over another is more a matter of personal style, but other times it can have consequences for the speed of your code. For instruction on best practices, see this supplementary lesson that demonstrates how to properly repeat operations in R.
Using Loops to Analyze Multiple Files
Write a function called
analyze_allthat takes a folder path and a filename pattern as its arguments and runsanalyzefor each file whose name matches the pattern.Solution
analyze_all <- function(folder = "data", pattern) {
  # Runs the function analyze for each file in the given folder
  # that contains the given pattern.
  filenames <- list.files(path = folder, pattern = pattern, full.names = TRUE)
  for (f in filenames) {
    analyze(f)
  }
}
Making Choices
Our previous lessons have shown us how to manipulate data, define our own functions, and repeat things. However, the programs we have written so far always do the same things, regardless of what data they’re given. We want programs to make choices based on the values they are manipulating.
Saving Plots to a File
So far, we have built a function analyze to plot summary statistics of the inflammation data:
analyze <- function(filename) {
  # Plots the average, min, and max inflammation over time.
  # Input is character string of a csv file.
  dat <- read.csv(file = filename, header = FALSE)
  avg_day_inflammation <- apply(dat, 2, mean)
  plot(avg_day_inflammation)
  max_day_inflammation <- apply(dat, 2, max)
  plot(max_day_inflammation)
  min_day_inflammation <- apply(dat, 2, min)
  plot(min_day_inflammation)
}
And also built the function analyze_all to automate the processing of each data file:
analyze_all <- function(folder = "data", pattern) {
  # Runs the function analyze for each file in the given folder
  # that contains the given pattern.
  filenames <- list.files(path = folder, pattern = pattern, full.names = TRUE)
  for (f in filenames) {
    analyze(f)
  }
}
While these are useful in an interactive R session, what if we want to send our results to our collaborators?
Since we currently have 12 data sets, running analyze_all creates 36 plots.
Saving each of these individually would be tedious and error-prone.
And in the likely situation that we want to change how the data is processed or the look of the plots, we would have to once again save all 36 before sharing the updated results with our collaborators.
Here’s how we can save all three plots of the first inflammation data set in a pdf file:
pdf("inflammation-01.pdf")
analyze("inflammation-01.csv")
dev.off()
The function pdf redirects all the plots generated by R into a pdf file, which in this case we have named “inflammation-01.pdf”.
After we are done generating the plots to be saved in the pdf file, we stop R from redirecting plots with the function dev.off.
Overwriting Plots
If you run
dev.off, you will save plots to the most recently opened file. However, you won’t be able to open the previous pdf files because the connections were not closed. In order to get out of this situation, you’ll need to rundev.offuntil all the pdf connections are closed. You can check your current status using the functiondev.cur. If it says “pdf”, all your plots are being saved in the last pdf specified. If it says “null device” or “RStudioGD”, the plots will be visualized normally.
We can update the analyze function so that it always saves the plots in a pdf.
But that would make it more difficult to interactively test out new changes.
It would be ideal if analyze would either save or not save the plots based on its input.
Conditionals
In order to update our function to decide between saving or not, we need to write code that automatically decides between multiple options. The tool R gives us for doing this is called a conditional statement, and looks like this:
num <- 37
if (num > 100) {
  print("greater")
} else {
  print("not greater")
}
print("done")
[1] "not greater"
[1] "done"
The second line of this code uses an if statement to tell R that we want to make a choice.
If the following test is true, the body of the if (i.e., the lines in the curly braces underneath it) are executed.
If the test is false, the body of the else is executed instead.
Only one or the other is ever executed:
In the example above, the test num > 100 returns the value FALSE, which is why the code inside the if block was skipped and the code inside the else statement was run instead.
num > 100
[1] FALSE
And as you likely guessed, the opposite of FALSE is TRUE.
num < 100
[1] TRUE
Conditional statements don’t have to include an else.
If there isn’t one, R simply does nothing if the test is false:
num <- 53
if (num > 100) {
  print("num is greater than 100")
}
We can also chain several tests together when there are more than two options. This makes it simple to write a function that returns the sign of a number:
sign <- function(num) {
  if (num > 0) {
    return(1)
  } else if (num == 0) {
    return(0)
  } else {
    return(-1)
  }
}

sign(-3)
[1] -1
sign(0)
[1] 0
sign(2/3)
[1] 1
Note that when combining else and if in an else if statement, the if portion still requires a direct input condition. This is never the case for the else statement alone, which is only executed if all other conditions go unsatisfied.
Note that the test for equality uses two equal signs, ==.
Other Comparisons
Other tests include greater than or equal to (
>=), less than or equal to (<=), and not equal to (!=).
We can also combine tests.
Two ampersands, &&, symbolize “and”.
Two vertical bars, ||, symbolize “or”.
&& is only true if both parts are true:
if (1 > 0 && -1 > 0) {
    print("both parts are true")
} else {
  print("at least one part is not true")
}
[1] "at least one part is not true"
while || is true if either part is true:
if (1 > 0 || -1 > 0) {
    print("at least one part is true")
} else {
  print("neither part is true")
}
[1] "at least one part is true"
In this case, “either” means “either or both”, not “either one or the other but not both”.
Choosing Plots Based on Data
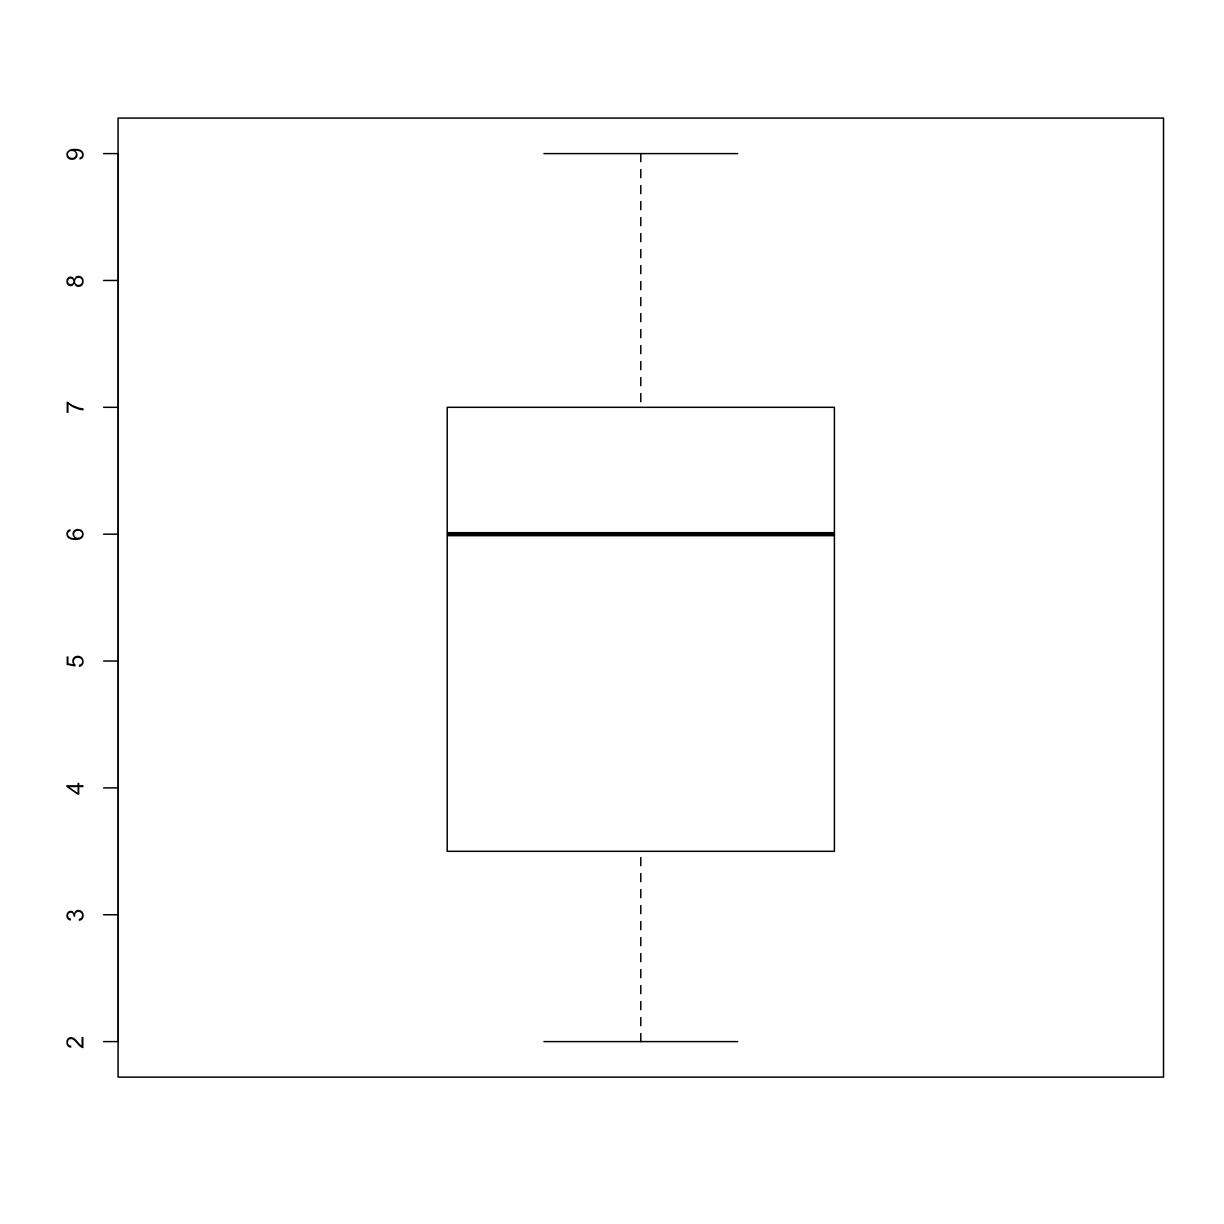
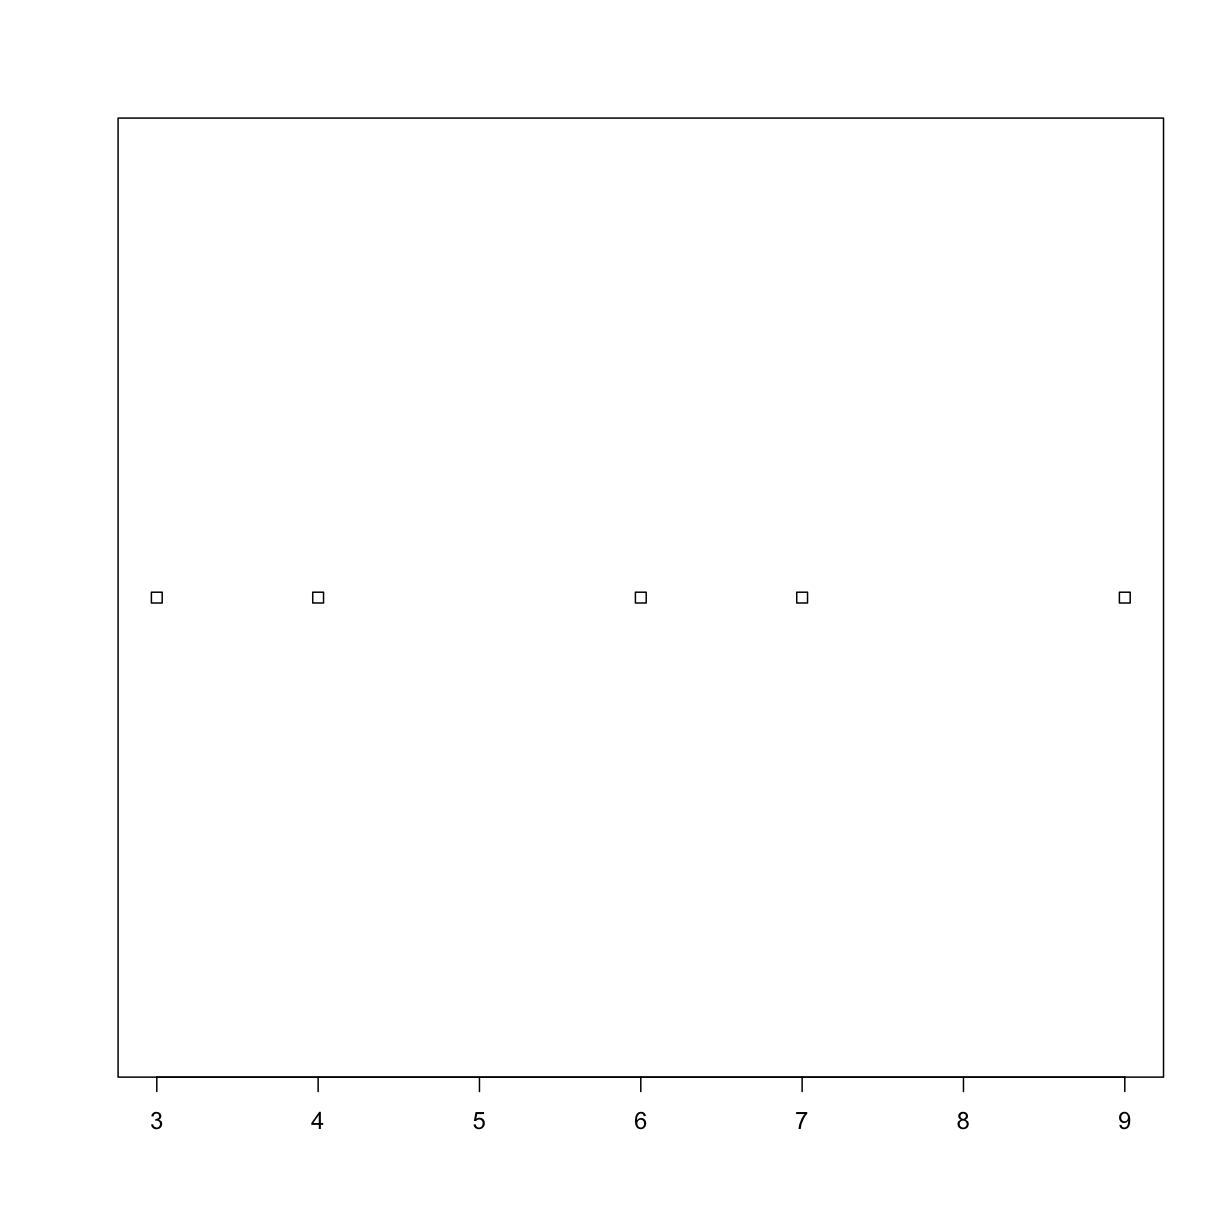
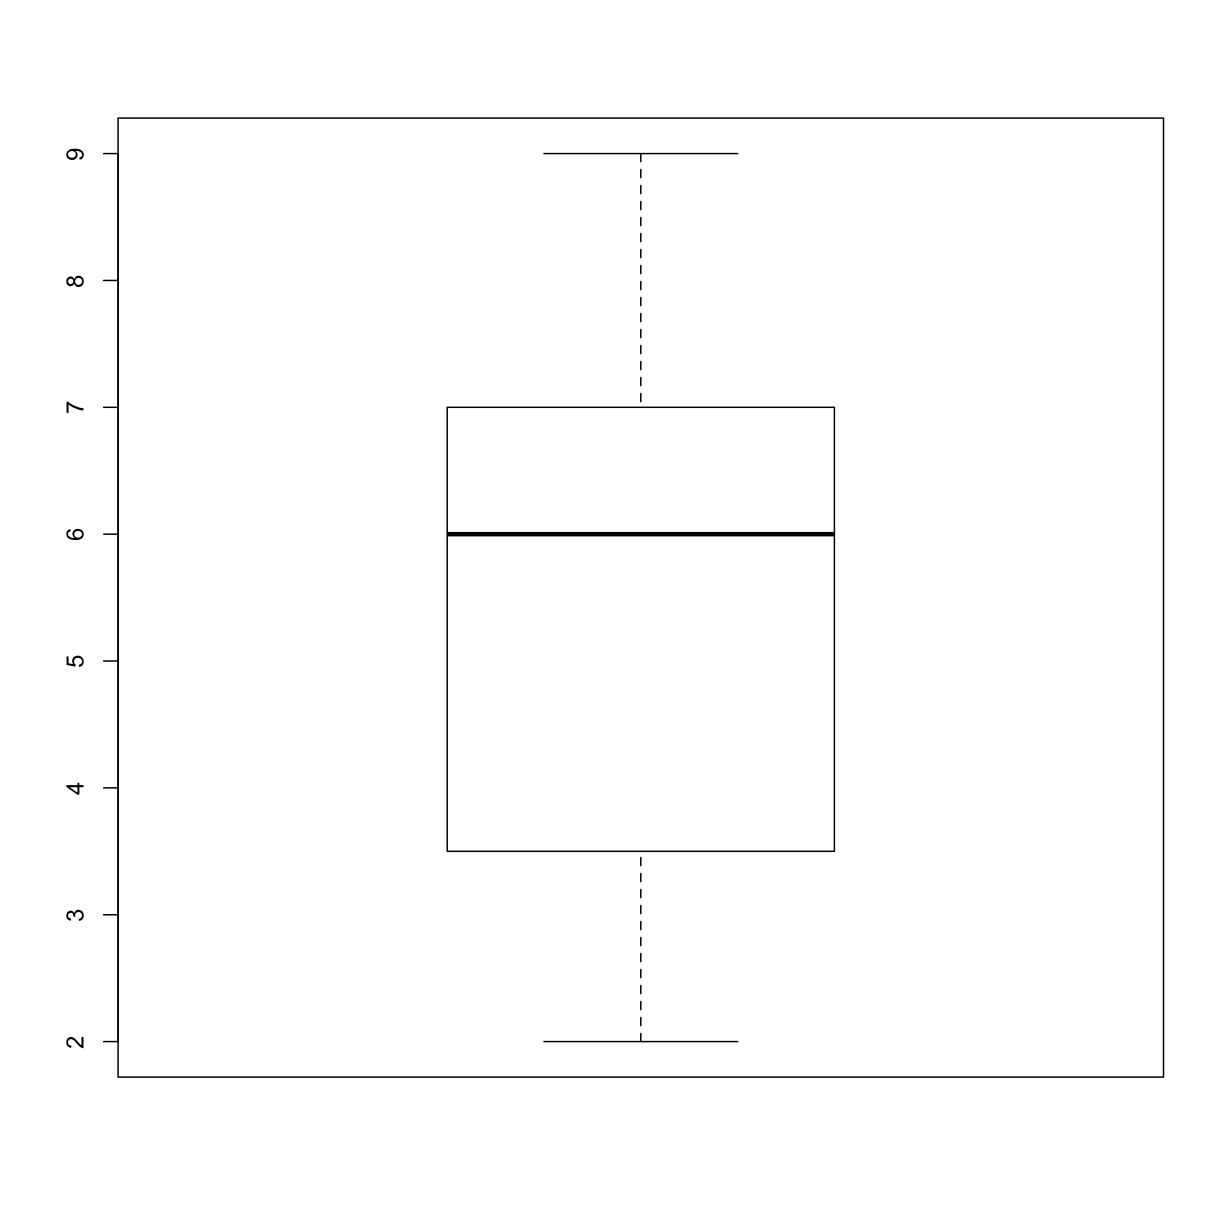
Write a function
plot_distthat plots a boxplot if the length of the vector is greater than a specified threshold and a stripchart otherwise. To do this you’ll use the R functionsboxplotandstripchart.dat <- read.csv("inflammation-01.csv", header = FALSE) plot_dist(dat[, 10], threshold = 10) # day (column) 10
plot_dist(dat[1:5, 10], threshold = 10) # samples (rows) 1-5 on day (column) 10
Solution
plot_dist <- function(x, threshold) {
  if (length(x) > threshold) {
    boxplot(x)
  } else {
    stripchart(x)
  }
}
Histograms Instead
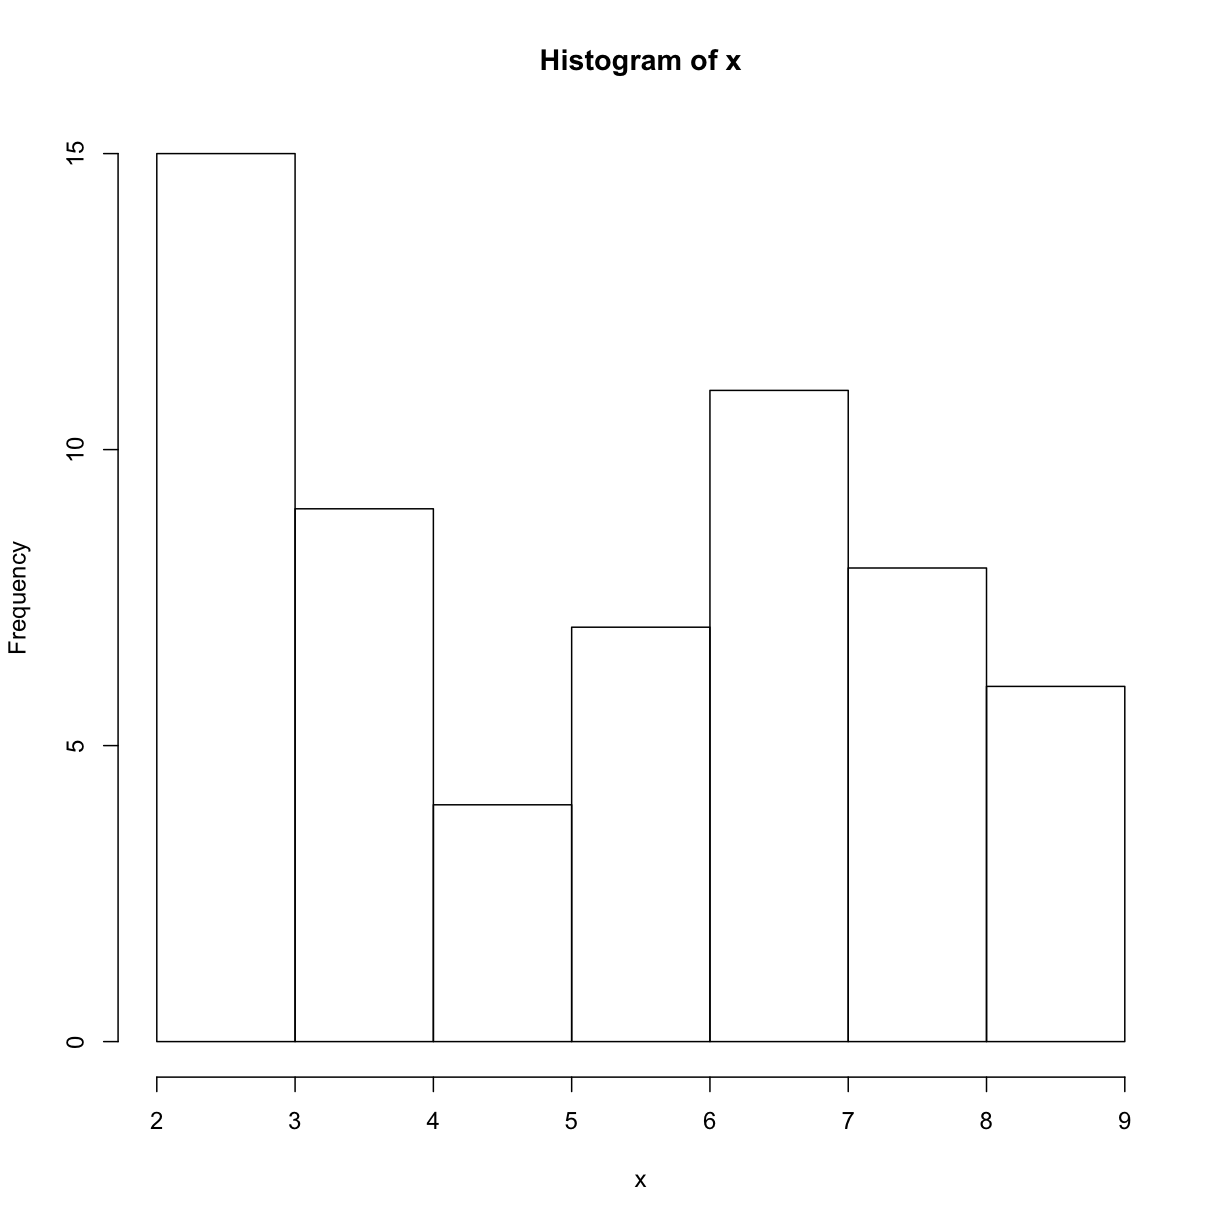
One of your collaborators prefers to see the distributions of the larger vectors as a histogram instead of as a boxplot. In order to choose between a histogram and a boxplot we will edit the function
plot_distand add an additional argumentuse_boxplot. By default we will setuse_boxplottoTRUEwhich will create a boxplot when the vector is longer thanthreshold. Whenuse_boxplotis set toFALSE,plot_distwill instead plot a histogram for the larger vectors. As before, if the length of the vector is shorter thanthreshold,plot_distwill create a stripchart. A histogram is made with thehistcommand in R.dat <- read.csv("inflammation-01.csv", header = FALSE) plot_dist(dat[, 10], threshold = 10, use_boxplot = TRUE) # day (column) 10 - create boxplot
plot_dist(dat[, 10], threshold = 10, use_boxplot = FALSE) # day (column) 10 - create histogram
plot_dist(dat[1:5, 10], threshold = 10) # samples (rows) 1-5 on day (column) 10
Solution
plot_dist <- function(x, threshold, use_boxplot = TRUE) {
   if (length(x) > threshold && use_boxplot) {
       boxplot(x)
   } else if (length(x) > threshold && !use_boxplot) {
       hist(x)
   } else {
       stripchart(x)
   }
}
Find the Maximum Inflammation Score
Find the file containing the patient with the highest average inflammation score. Print the file name, the patient number (row number) and the value of the maximum average inflammation score.
Tips:
- Use variables to store the maximum average and update it as you go through files and patients.
- You can use nested loops (one loop is inside the other) to go through the files as well as through the patients in each file (every row).
Complete the code below:
filenames <- list.files(path = "data", pattern = "inflammation-[0-9]{2}.csv", full.names = TRUE)
filename_max <- "" # filename where the maximum average inflammation patient is found
patient_max <- 0 # index (row number) for this patient in this file
average_inf_max <- 0 # value of the average inflammation score for this patient
for (f in filenames) {
  dat <- read.csv(file = f, header = FALSE)
  dat.means <- apply(dat, 1, mean)
  for (patient_index in 1:length(dat.means)){
    patient_average_inf <- dat.means[patient_index]
    # Add your code here ...
  }
}
print(filename_max)
print(patient_max)
print(average_inf_max)
Solution
# Add your code here ...
if (patient_average_inf > average_inf_max) {
  average_inf_max <- patient_average_inf
  filename_max <- f
  patient_max <- patient_index
}
Saving Automatically Generated Figures
Now that we know how to have R make decisions based on input values,
let’s update analyze:
analyze <- function(filename, output = NULL) {
  # Plots the average, min, and max inflammation over time.
  # Input:
  #    filename: character string of a csv file
  #    output: character string of pdf file for saving
  if (!is.null(output)) {
    pdf(output)
  }
  dat <- read.csv(file = filename, header = FALSE)
  avg_day_inflammation <- apply(dat, 2, mean)
  plot(avg_day_inflammation)
  max_day_inflammation <- apply(dat, 2, max)
  plot(max_day_inflammation)
  min_day_inflammation <- apply(dat, 2, min)
  plot(min_day_inflammation)
  if (!is.null(output)) {
    dev.off()
  }
}
We added an argument, output, that by default is set to NULL.
An if statement at the beginning checks the argument output to decide whether or not to save the plots to a pdf.
Let’s break it down.
The function is.null returns TRUE if a variable is NULL and FALSE otherwise.
The exclamation mark, !, stands for “not”.
Therefore the line in the if block is only executed if output is “not null”.
output <- NULL
is.null(output)
[1] TRUE
!is.null(output)
[1] FALSE
Now we can use analyze interactively, as before,
analyze("inflammation-01.csv")
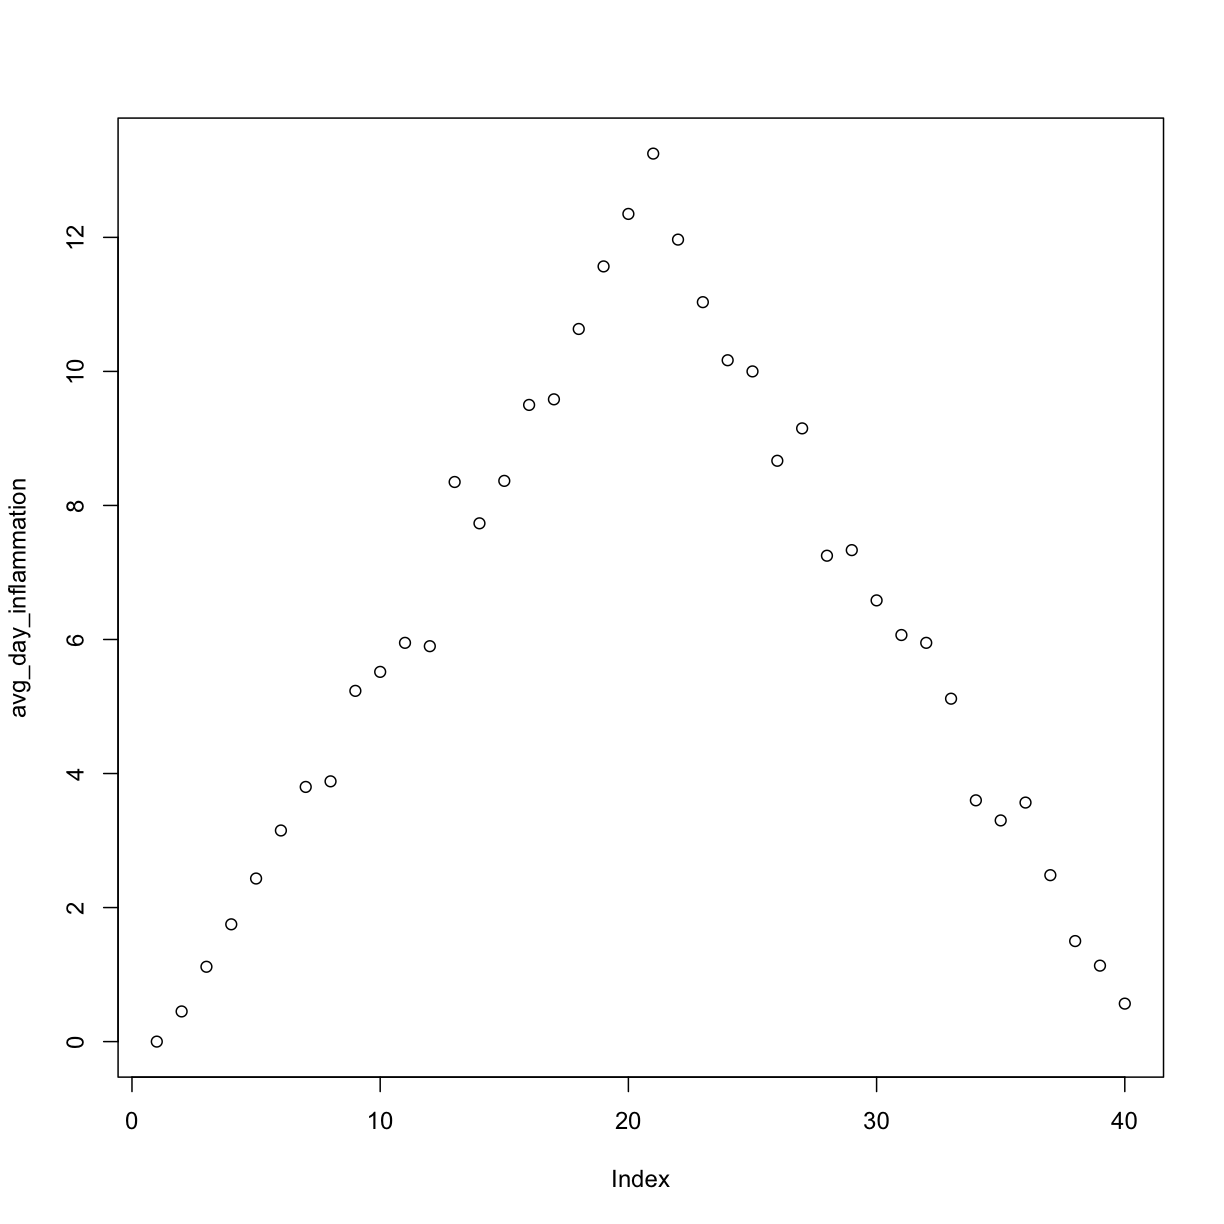
but also use it to save plots,
analyze("inflammation-01.csv", output = "inflammation-01.pdf")
Before going further, we will create a directory results for saving our plots.
It is good practice in data analysis projects to save all output to a directory separate from the data and analysis code.
You can create this directory using the shell command mkdir, or the R function dir.create()
dir.create("results")
Now run analyze and save the plot in the results directory,
analyze("inflammation-01.csv", output = "results/inflammation-01.pdf")
This now works well when we want to process one data file at a time, but how can we specify the output file in analyze_all?
We need to do two things:
- Substitute the filename ending “csv” with “pdf”.
- Save the plot to the
resultsdirectory.
To change the extension to “pdf”, we will use the function sub,
f <- "inflammation-01.csv"
sub("csv", "pdf", f)
[1] "inflammation-01.pdf"
To add the “results” directory to the filename use the function file.path,
file.path("results", sub("csv", "pdf", f))
[1] "results/inflammation-01.pdf"
Now let’s update analyze_all:
analyze_all <- function(pattern) {
  # Directory name containing the data
  data_dir <- "data"
  # Directory name for results
  results_dir <- "results"
  # Runs the function analyze for each file in the current working directory
  # that contains the given pattern.
  filenames <- list.files(path = data_dir, pattern = pattern)
  for (f in filenames) {
    pdf_name <- file.path(results_dir, sub("csv", "pdf", f))
    analyze(file.path(data_dir, f), output = pdf_name)
  }
}
Now we can save all of the results with just one line of code:
analyze_all("inflammation.*csv")
Now if we need to make any changes to our analysis, we can edit the analyze function and quickly regenerate all the figures with analyze_all.
Changing the Behavior of the Plot Command
One of your collaborators asks if you can recreate the figures with lines instead of points. Find the relevant argument to
plotby reading the documentation (?plot), updateanalyze, and then recreate all the figures withanalyze_all.Solution
analyze <- function(filename, output = NULL) {
  # Plots the average, min, and max inflammation over time.
  # Input:
  #    filename: character string of a csv file
  #    output: character string of pdf file for saving
  if (!is.null(output)) {
    pdf(output)
  }
  dat <- read.csv(file = filename, header = FALSE)
  avg_day_inflammation <- apply(dat, 2, mean)
  plot(avg_day_inflammation, type = "l")
  max_day_inflammation <- apply(dat, 2, max)
  plot(max_day_inflammation, type = "l")
  min_day_inflammation <- apply(dat, 2, min)
  plot(min_day_inflammation, type = "l")
  if (!is.null(output)) {
    dev.off()
  }
}
Based on the tutorials by the The Carpentries.
